
Basic Concepts of Macroeconomics/Classification
Basic Concepts of Macroeconomics The Classification of Economic System
Basic Concepts of Macroeconomics
What is Economics?
Economics is the Social Science that analyzes the production, distribution and consumption of goods and services. Broadly, Economics is a social science that studies human activities aimed at satisfying needs and wants. It encompasses production, distribution, trade and consumption of goods and services.
Economics is the Social Science that analyzes the production, distribution and consumption of goods and services. Broadly, Economics is a social science that studies human activities aimed at satisfying needs and wants. It encompasses production, distribution, trade and consumption of goods and services.
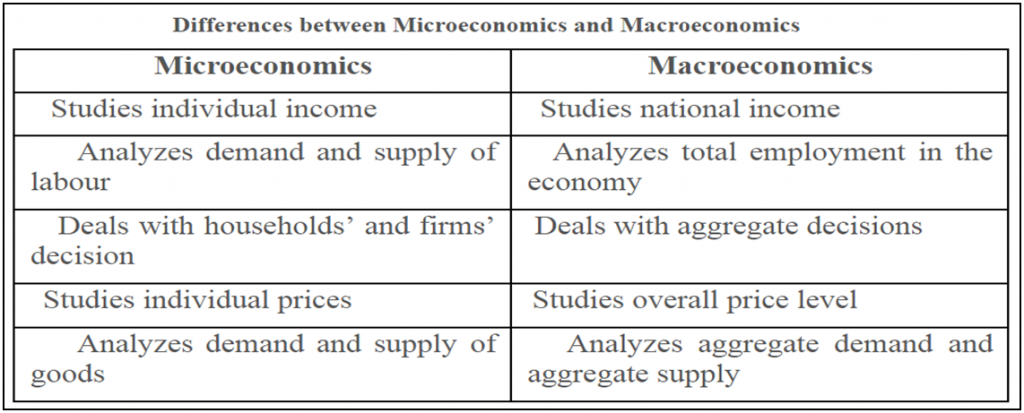
Economics is usually divided into two main branches:
• Microeconomics – which examines the economic behavior of individual actors such as consumer, business, households etc. to understand how decisions are made in the face of scarcity and what effects they have on larger economy.
• Macroeconomics – which studies the economy and its features like National Income, Employment, Poverty, Balance of Payments and Inflation.
What is Macroeconomics?
• Macroeconomics is a branch of economics which studies the economy as a whole. It deals with the performance, structure and behavior of economy at national or regional level.
• It studies about aggregated indicators such as GDP, Unemployment Rates and Price Indices to understand how the whole economy functions.
• It develops models that explain the relationship between such factors as National Income, Output, Consumption, Unemployment, Inflation, Savings, Investment, International Trade and International Finance.
Vital Process of an Economy
By Vital Process we mean process without which an economy cannot exist. There are three vital process of an economy:
1. Production
2. Consumption
3. Investment
A. Production
• In economy the word production includes not only the making of various goods but also the services. For all of us services are also as essential as the goods. In fact, some of the goods cannot be used unless the services are not provided such as Television or Radio cannot be used unless the services of artists or technicians are provided. Thus production includes the goods made and the services provided in an economy.
• There are some services which are provided by family members to themselves or to one another like cooking and washing clothes, cleaning the house, ironing clothes, polishing shoes and so on.
• Such services are also a part of production but when it comes to measurement of the value of these services, problems arise about getting the required data of the quantity and value of these services. As such, in practical estimates, these services are left out of production.
• Similarly, all leisure time, activities such as growing fruits, flowers and vegetables in garden are also excluded from production for the same reason.
B. Consumption
• It is defined as an activity concerned with using up of goods and services for direct satisfaction of wants. In other words, consumption is an act of satisfying one’s wants.
• Consumption also includes consumption of both goods and services. For Example: we consume food, clothes, furniture etc. We use services of tailors, barbers, washerman, repairers, tutors ect.
• Consumption activity takes place as soon as we buy these goods and services. In other words, by consumption we mean acquiring of goods and services for consumption.
• All purchases by households, with an exception of purchase of a house, are consumption purchases.
C. Investment
• Whatever is produced during a year is not generally acquired for consumption in that year and is kept for future use in order to acquire more monetary amount or benefits.
• Goods lying with production units as raw materials in the process of production to satisfy the demands are also investment which will bear the result in future.
• Investment in fixed capitals by production units like machines, equipments, vehicles, buildings etc. during the year which are also known as durable use goods. Such components are meant to production of goods which may or may not be used in the same year and are kept for future use are also known as investment.
• During a particular year the goods are exceeding the production because of investment in various levels.
Production, consumption and investment processes are interrelated in the following manner
• First, production is the source of consumption and investment. If there is no production there would be no consumption and investment. Given production, if there is more consumption less would be available for investment.
• Second, consumption provides motivation for production and investment. If there is no need for consumption, there is no need to invest and produce.
• Third, investment determines the level of production. The more we invest, the more we can produce.
• Fourth, saving is the major source of financing investment. More saving means more investment which in turn means more production leading to more consumption and investment.
There are two components responsible for the excess of goods (during a particular year)
1. Stock Investment: Addition to the stock of raw material, semi-finished goods and finished goods during a year is called stock investment or inventory investment. Such a stock at the beginning of the year is called opening stock and at the end of the year is known as closing stock.
– The excess of closing stock over the opening stock is called inventory investment.
– However, it is possible that during a particular year the production may be less than consumption. It implies that the closing stock is less than the opening stock. This is called negative investment or disinvestment.
2. Fixed Investment: Acquiring up of durable use producer goods by production units is called fixed investment such as adding new machines and equipments etc.
– Total investment equals the sum of inventory investment and fixed investment. The alternative name of investment is capital formation.
– Total investment equals the sum of inventory investment and fixed investment. The alternative name of investment is capital formation.
Consumption Expenditure and Saving
Wages, salaries, rents, interests and profits earned by an individual has two alternatives: Consumption Expenditure and Saving.
Wages, salaries, rents, interests and profits earned by an individual has two alternatives: Consumption Expenditure and Saving.
1. Consumption Expenditure: It’s a part of the income is spent on acquiring goods and services for satisfaction of wants.
2. Saving: The unspent part of income is called saving. Thus saving equals excess of income over expenditure. The saving is in the form of money.
3. Saving = Income – Consumption Expenditure
4. Why do people do save?
a. For emergency expenses on illness, old age or any other unexpected expenditure.
b. The main motive is to earn interest income by lending these savings. It gives them an additional source of income in future years.
c. Savings play an important role in production process. In fact saving is a major source of financing investment. Higher the savings more the possibility of investment. Investment means acquiring goods and services for production. Savings are used to acquire investment goods. So, saving is the foundation of investment.
Other Basic Terminologies
A. Final Goods
• The commodity produced by an enterprise is being sold out to the consumers. In the process the commodity goes under various transformations through productive processes into other goods before being sold to the consumers for Final Use. Such an item that is meant for final use and will not pass through any more stages of production or transformation is called a Final Good.
• Why Final Good? Once sold to the consumer, it passes out of the active economic flow and will not undergo further transformation by the action of the ultimate purchaser. Thus, it is not in the nature of the good but in the economic nature of its use that a good becomes a final good.
• For example: A car sold to a Consumer is a final good; the components such as tyres sold to the car manufacturer are not; they are intermediate goods used to make the final goods. The same tyres, if sold to a consumer, would be final goods.
Final goods are divided into two parts: Consumption Goods and Capital Goods
a) Consumption Goods
• Tangible goods that are produced and subsequently purchased for direct consumption to satisfy the current human needs or wants.
• Example: Food, Clothing, Cigarettes, Pen, TV Set, and Radio etc.
• Similarly, services rendered to consumers by hotels, retailers, barbers etc. are Consumer Services as they satisfy the immediate needs of the consumers.
• Consumer Goods are divided into two categories: Durable Goods and Non-Durable Goods
• Durable Goods: This can be used in consumption again and again over a considerable period of time. e.g., chair, car, fridge, shoes, TV set etc.
• Non-Durable Goods: are like single use goods which are used up by consumers in a single act of consumption, e.g., milk, fruits, matches, cigarettes, coal, etc.
b) Capital Goods
• Capital goods are fixed assets of producers which are repeatedly used in production of other goods and services. Alternatively durable goods which are bought for producing other goods but not for meeting immediate needs of the consumer are called capital goods.
• These goods are of durable character.
• For Example: tools, implements, machinery, plants, tractors, buildings, transformers, etc.
• Capital Goods are used for generating income by production units. While they make production of other goods possible, they themselves do not get transformed (or merged) in the production process. Capital Goods undergo wear and tear and need repairs or replacement over time.
• Capital Goods are the backbone of production processes as they aid and enable production to go on continuously.
• Capital goods are purchased by the business enterprises either for maintenance or addition to their capital stock so as to maintain or expand the flow of their production.
B. Intermediate Goods
• Goods that are used by a business in the production of other goods or services. It is also referred to as producer goods. Intermediate Goods are used to make Consumer Goods.
• For Example: Timber and steel rods are intermediate products because they are sold by the timber merchant or the steel dealer to the builder who uses them to produce the final product – a house or a building.
C. Depreciation
• Almost everything we see around us has a useful life because it is being used up little by little every day or will become outdated as technology changes. This ‘using up’ is called depreciation.
• In other words, ‘The monetary value of an asset decreases over the time due to use, wear and tear or obsolescence. This decrease is measured as Depreciation.’
• When the value of asset(s) erodes completely the capital asset has to be either replaced or repaired. Expenses incurred for replacing and repairing are called depreciation expenditure.
• Therefore, Gross Investment = Net Investment + Depreciation
• Net Investment will increase the production capacity and output of a nation, but not by depreciation expenditure. So we have, NNP = GNP – Depreciation.
• The governments of the economies decide and announce the rates by which assets depreciate and a list is published, which is used by the different sections of the economy to determine the real levels of depreciations in different assets.
Economic Survey Chapter – 1
Economic Outlook and Policy Challenges
Economic Outlook and Policy Challenges (Economic Survey Chapter – 1)
Context
The Indian Economy has sustained a macro-economic environment of relatively lower inflation, fiscal discipline and moderate current account deficit coupled with broadly stable rupee-dollar exchange rate.
As per the advance estimates released by the Central Statistics Office, the growth rate of GDP at constant market prices for the year 2016-17 is placed at 7.1 per cent, as against 7.6 per cent in 2015-16.This estimate is based mainly on information for the first seven to eight months of the financial year. Government final consumption expenditure is the major driver of GDP growth in the current year.
This year has been marked by several historic economic policy developments. On the domestic side, a constitutional amendment paved the way for the long-awaited and transformational goods and services tax (GST) while demonetisation of the large currency notes signaled a regime shift to punitively raise the costs of illicit activities. On the international front, Brexit and the US elections may herald a tectonic shift, forebodingly laden with darker possibilities for the global, and even the Indian, economy.
Each had impact on the Indian economy which have been analysed in the following chapter.
This year has been marked by several historic economic policy developments. On the domestic side, a constitutional amendment paved the way for the long-awaited and transformational Goods and Services Tax (GST) while demonetisation of the large currency notes signalled a regime shift to punitively raise the costs of illicit activities. On the international front, Brexit and the US elections may herald a tectonic shift, forebodingly laden with darker possibilities for the global, and even the Indian, economy.
A radical governance-cum-social engineering measure was enacted on November 8, 2016. The two largest denomination notes, Rs 500 and Rs 1000-together comprising 86 percent of all the cash in circulation-were “demonetised” with immediate effect, ceasing to be legal tender except for a few specified purposes.
The aim of the action was fourfold: to curb corruption, counterfeiting, the use of high denomination notes for terrorist activities, and especially the accumulation of “black money”, generated by income that has not been declared to the tax authorities. The action followed a series of earlier efforts to curb such illicit activities, including the creation of the Special Investigation Team (SIT) in the 2014 budget, the Black Money Act, 2015; the Benami Transactions Act of 2016; the information exchange agreement with Switzerland, changes in the tax treaties with Mauritius and Cyprus, and the Income Disclosure Scheme.
Beyond these headline reforms were other less-heralded but nonetheless important actions. The government enacted a package of measures to assist the clothing sector that by virtue of being export-oriented and labour-intensive could provide a boost to employment, especially female employment. The National Payments Corporation of India (NPCI) successfully finalized the Unified Payments Interface (UPI) platform. By facilitating inter-operability it will unleash the power of mobile phones in achieving digitalization of payments and financial inclusion, and making the “M” an integral part of the government’s flagship “JAM”-Jan Dhan, Aadhar, and Mobile- initiative. Further FDI reform measures were implemented, allowing India to become one of the world’s largest recipients of foreign direct investment.
These measures cemented India’s reputation as one of the few bright spots in an otherwise grim global economy. India is not only among the world’s fastest growing major economies, underpinned by a stable macro-economy with declining inflation and improving fiscal and external balances.
Future reforms need to consider three major challenges: Reducing Inefficient redistribution,” strengthening state capacity in delivering essential services and regulating markets, and dispelling the ambivalence about protecting property rights and embracing the private sector.
The central government alone runs about 950 central sector and centrally sponsored schemes and sub-schemes which cost about 5 percent of GDP. Restructuring it will require efforts and time and even then limited results could be expected.
Competitive federalism has been a powerful agent of change in relation to attracting investment and talent; it has been less in evidence in relation to essential service delivery.
The improvement of the Public Distribution System (PDS) in Chhattisgarh, the incentivization of agriculture in Madhya Pradesh, reforms in the power sector in Gujarat which improved delivery and cost recovery, the efficiency of social programs in Tamil Nadu, and the recent use of technology to help make Haryana kerosene-free.
But on health and education there are insufficient instances of good models that can travel widely within India and that are seen as attractive political opportunities. Competitive populism needs a counterpart in competitive service delivery.
Trade as Engine of Growth
Given that India’s growth ambitions of 8-10 percent require export growth of about 15-20 percent, any serious retreat from openness on the part of India’s trading partners would jeopardize those ambitions.
For India, three external developments are of significant consequence. In the short run, the change in the outlook for global interest rates as a result of the US elections and the implied change in expectations of US fiscal and monetary policy will impact on India’s capital ?ows and exchange rates. Markets are factoring in a regime change in advanced countries, especially US macroeconomic policy, with high expectations of fiscal stimulus.
Second, the medium-term political outlook for globalisation and in particular for the world’s “political carrying capacity for globalisation” may have changed in the wake of recent developments. In the short run a strong dollar and declining competitiveness might exacerbate the lure of protectionist policies.
Third, developments in the US, especially the rise of the dollar, will have implications for China’s currency and currency policy. If China is able to successfully re-balance its economy, the spill over effects on India and the rest of the world will be positive.
Developments during 2016-17
Real GDP growth in the first half of the year was 7.2 percent, on the weaker side of the 7.0-7.75 per cent projection in the Economic Survey 2015-16 and somewhat lower than the 7.6 percent rate recorded in the second half of 2015-16.
The main problem was fixed investment, which declined sharply as stressed balance sheets in the corporate sector continued to take a toll on firm’s’ spending plans. On the positive side, the economy was buoyed by government consumption, as the 7th Pay Commission salary recommendations were implemented.
The major highlights of the sectoral growth outcome of the first half of 2016-17 were:
(i) Moderation in industrial and nongovernment service sectors;
(ii) The modest pick-up in agricultural growth on the back of improved monsoon; and
(iii) Strong growth in public administration and defence services
The Consumer Price Index (CPI)- New Series infation, which averaged 4.9 per cent during April-December 2016, has displayed a downward trend since July when it became apparent that kharif agricultural production in general, and pulses in particular would be bountiful. The decline in pulses prices has contributed substantially to the decline in CPI infation which reached 3.4 percent at end-December.
The second distinctive feature has been the reversal of WPI inflation, from a low of (-) 5.1 percent in August 2015 to 3.4 percent at end-December 2016.
The outlook for the year as a whole is for CPI in?ation to be below the RBI’s target of 5 percent, a trend likely to be assisted by demonetisation.
External Sector
The current account deficit has declined to reach about 0.3 percent of GDP in the first half of FY 2017. Foreign exchange reserves are at comfortable levels, having have risen from around US$350 billion at end-January 2016 to US$ 360 billion at end-December 2016 and are well above standard norms for reserve adequacy.
In part, surging net FDI in flows, which grew from 1.7 percent of GDP in FY2016 to 3.2 percent of GDP in the second quarter of FY2017, helped the balance-of-payments.
The trade deficit declined by 23.5 per cent in April-December 2016 over corresponding period of previous year. During the first half of the fiscal year, the main factor was the contraction in imports, which was far steeper than the fall in exports. But during October-December, both exports and imports started a long-awaited recovery, growing at an average rate of more than 5 per cent.
The improvement in exports appears to be linked to improvements in the world economy, led by better growth in the US and Germany.
The net services surplus declined in the first half, as software service exports slowed and financial service exports declined. Net private remittances declined by $4.5 bn in the first half of 2016- 17 compared to the same period of 2015-16, weighed down by the lagged effects of the oil price decline, which affected in?ows from the Gulf region.
Fiscal Performance
Trends in the fiscal sector in the first half have been unexceptional and the central government is committed to achieving its fiscal deficit target of 3.5 percent of GDP this year. Excise duties and services taxes have benefited from the additional revenue measures introduced last year.
The most notable feature has been the over-performance of excise duties in turn based on buoyant petroleum consumption: real consumption of petroleum products (petrol) increased by 11.2 percent during April-December 2016 compared to same period in the previous year.
Indirect taxes, especially petroleum excises, have held up even after demonetisation in part due to the exemption of petroleum products from its scope.
Non-tax revenues have been challenged owing to shortfall in spectrum and disinvestment receipts but also to forecast optimism; the stress in public sector enterprises has also reduced dividend payments.
The consolidated deficit of the states has increased steadily in recent years, rising from 2.5 percent of GDP in 2014-15 to 3.6 percent of GDP in 2015-16, in part because of the UDAY scheme.
Economic Outlook
Demonetization
Demonetisation affects the economy through three different channels. It is potentially:
• An aggregate demand shock because it reduces the supply of money and affects private wealth, especially of those holding unaccounted money;
• An aggregate supply shock to the extent that economic activity relies on cash as an input (for example, agricultural production might be affected since sowing requires the use of labour traditionally paid in cash); and
• An uncertainty shock because economic agents face imponderables related to the magnitude and duration of the cash shortage and the policy responses (perhaps causing consumers to defer or reduce discretionary consumption and firms to scale back investments).
Impact on GDP
Consumer spending and two-wheelers, as the best indicator of both rural and less affuent demand;
• Real credit growth; and
• Real estate prices
Contrary to early fears, as of January 15, 2017 aggregate sowing of the two major rabi crops-wheat and pulses (gram)–exceeded last year’s planting by 7.1 percent and 10.7 percent, respectively .
Recorded GDP growth in the second half of FY 2017 will understate the overall impact because the most affected parts of the economy-informal and cash-based- are either not captured in the national income accounts or to the extent they are, their measurement is based on formal sector indicators.
For example, informal manufacturing is proxied by the Index of Industrial Production, which includes mostly large establishments. So, on the production or supply side, the effect on economic activity will be underestimated.
Outlook for 2017-18
India’s exports appear to be recovering, based on an uptick in global economic activity. This is expected to continue in the aftermath of the US elections and expectations of a fiscal stimulus.
The IMF’s January update of its World Economic Outlook forecast is projecting an increase in global growth from 3.1 percent in 2016 to 3.4 percent in 2017, with a corresponding increase in growth for advanced economies from 1.6 percent to 1.9 percent. Given the high elasticity of Indian real export growth to global GDP, exports could contribute to higher growth next year, by as much as 1 percentage point.
International oil prices are expected to be about 10-15 percent higher in 2017 compared to 2016, which would create a drag of about 0.5 percentage points. On the other hand, consumption is expected to receive a boost from two sources: catch-up after the demonetisation-induced reduction in the last two quarters of 2016-17; and cheaper borrowing costs, which are likely to be lower in 2017 than 2016 by as much as 75 to 100 basis points. As a result, spending on housing and consumer durables and semi-durables could rise smartly.
Since no clear progress is yet visible in tackling the twin balance sheet problem, private investment is unlikely to recover significantly from the levels of FY 2017. Some of this weakness could be offset through higher public investment, but that would depend on the stance of fiscal policy next year, which has to balance the short-term requirements of an economy recovering from demonetisation against the medium-term necessity of adhering to fiscal discipline-and the need to be seen as doing so.
Putting these factors together, we expect real GDP growth to be in the 6¾ to 7½ percent range in FY 2018. Even under this forecast, India would remain the fastest growing major economy in the world.
There are three main downside risks to the forecast. First, the extent to which the effects of demonetisation could linger into next year, especially if uncertainty remains on the policy response. Currency shortages also affect supplies of certain agricultural products, especially milk (where procurement has been low), sugar (where cane availability and drought in the southern states will restrict production), and potatoes and onions (where sowings have been low). Vigilance is essential to prevent other agricultural products becoming in 2017-18 what pulses were in 2015-16.
Fiscal Outlook
The fiscal outlook for the central government for next year will be marked by three factors. First, the increase in the tax to GDP ratio of about 0.5 percentage points in each of the last two years, owing to the oil windfall will disappear. In fact, excise-related taxes will decline by about 0.1 percentage point of GDP, a swing of about 0.6 percentage points relative to FY2017.
Second, there will be a fiscal windfall both from the high denomination notes that are not returned to the RBI and from higher tax collections as a result of increased disclosure under the Pradhan Mantra Garib Kalyan Yojana (PMGKY). Both of these are likely to be one-off in nature, and in both cases the magnitudes are uncertain.
A third factor will be the implementation of the GST. It appears that the GST will probably be implemented later in the fiscal year. The transition to the GST is so complicated from an administrative and technology perspective that revenue collection will take some time to reach full potential.
Combined with the government’s commitment to compensating the states for any shortfall in their own GST collections (relative to a baseline of 14 percent increase), the outlook must be cautious with respect to revenue collections. The fiscal gains from implementing the GST and demonetisation, while almost certain to occur, will probably take time to be fully realized.
Macro-Economic Outlook
An economy recovering from demonetisation will need policy support. On the assumption that the equilibrium cash-GDP ratio will be lower than before November 8, the banking system will benefit from a higher level of deposits. Thus, market interest rates-deposits, lending, and yields on g-secs-should be lower in 2017-18 than 2016-17.
This will provide a boost to the economy (provided, of course, liquidity is no longer a binding constraint). A corollary is that policy rates can be lower not necessarily to lead and nudge market rates but to validate them. Of course, any sharp uptick in oil prices and those of agricultural products, would limit the scope for monetary easing.
Fiscal policy is another potential source of policy support. This year the arguments may be slightly different from those of last year in two respects. Unlike last year, there is more cyclical weakness on account of demonetisation.
Moreover, the government has acquired more credibility, because of posting steady and consistent improvements in the fiscal situation for three consecutive years, the central government fiscal deficit declining from 4.5 percent of GDP in 2013- 14 to 4.1 percent, 3.9 percent, and 3.5 percent in the following three years. But fiscal policy needs to balance the cyclical imperatives with medium term issues relating to prudence and credibility.
Exchange Rate Policy
Given India’s need for exports to sustain a healthy growth rate, it is important to track India’s competitiveness.
A second reason to review India’s competitiveness is the rise of countries such as Vietnam, Bangladesh, and the Philippines that compete with India across a range of manufacturing and services.
A simple look at the indices of real effective exchange rates suggests that since the crisis of 2013, India’s rupee has appreciated by 19.4 percent (October 2016 over Jan 2014) according to the IMF’s measure, and 12.0 percent according to the RBI’s measure.
Both these indices could be potentially misleading. The RBI’s measure for example assigns an unusually high weight to the United Arab Emirates as it is a major source of India’s oil imports, and a trans-shipment point for India’s exports. But little of this trade has to do with competitiveness.
The surprising finding is that the IMF and RBI indices overstate the rupee’s appreciation since 2014, largely because they give such a large weight to the euro, which has been exceptionally weak. When the rupee is compared mainly to the comparatively stronger Asian currencies both REERASIA-M and REER-ASIA-H show the loss of competitiveness has been much less, 8.3 percent and 10.4 percent respectively (October 2016 over January 2014).
In other words, India has managed to maintain export competitiveness despite capital in?ows and in?ation that has been greater than in trading partners. Re?ecting this, India’s global market share in manufacturing exports has risen between 2010 and 2015.
Trade Policy
At a time of a possible resurgence of protectionist pressures and India’s need for open markets abroad to underpin rapid economic growth domestically, it is increasingly clear that India and other emerging market economies must play a more proactive role in ensuring open global markets.
At the same time, with the likely US retreat from regional initiatives such as the Trans-Pacific Partnership (TPP) in Asia and the Trans-Atlantic Trade and Investment Partnership (TTIP) with the EU, it is possible that the relevance of the World Trade Organization might increase. As a major stakeholder and given the geo-political shifts under way, reviving the WTO and multilateralism more broadly could be proactively pursued by India.
Women
This burden on women can take several forms: threat to life and safety while going out for open defecation, reduction in food and water intake practices to minimize the need to exit the home to use toilets, polluted water leading to women and children dying from childbirth-related infections, and a host of other impacts.
Women’s personal hygiene is therefore important not just for better health outcomes but also for the intrinsic value in conferring freedom that comes from having control over their bodies, a kind of basic right to physical privacy. Put differently, impeded access may well be creating “gender-based sanitation insecurity.”
Other Random Observations
1. New estimates based on railway passenger traffic data reveal annual work-related migration of about 9 million people, almost double what the 2011 Census suggests.
2. China’s credit rating was upgraded from A+ to AA- in December 2010 while India’s has remained unchanged at BBB-. From 2009 to 2015, China’s credit-to-GDP soared from about 142 percent to 205 percent and its growth decelerated. The contrast with India’s indicators is striking, which have remained low in range of 70-80.
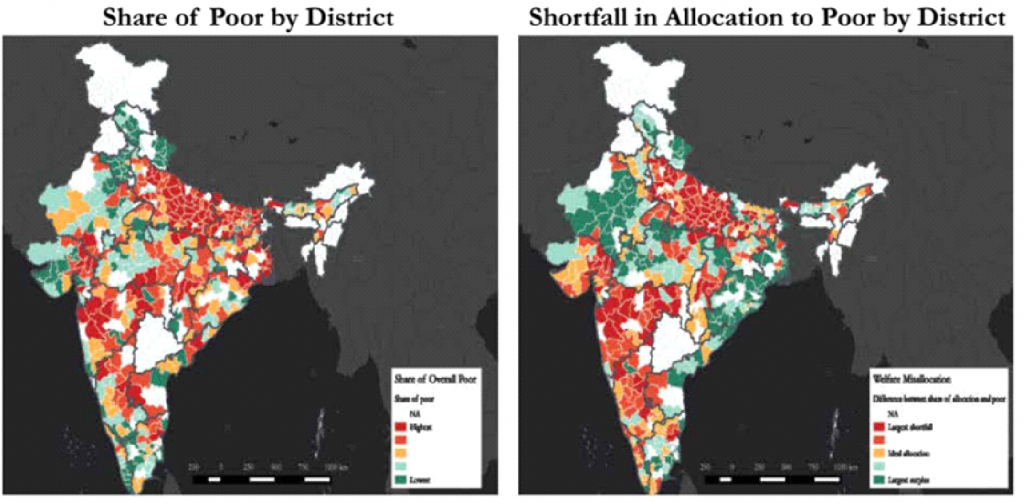
3. Welfare spending in India suffers from misallocation: as the pair of charts show, the districts with the most poor (in red on the left) are the ones that suffer from the greatest shortfall of funds (in red on the right) in social programs. The districts accounting for the poorest 40% receive 29% of the total funding.
4. India has 7 taxpayers for every 100 voters ranking us 13th amongst 18 of our democratic G-20 peers.
5. India’s share of working age to non-working age population will peak later and at a lower level than that for other countries but last longer. The peak of the growth boost due to the demographic dividend is fast approaching, with peninsular states peaking soon and the hinterland states peaking much later.
1. New estimates based on railway passenger traffic data reveal annual work-related migration of about 9 million people, almost double what the 2011 Census suggests.
2. China’s credit rating was upgraded from A+ to AA- in December 2010 while India’s has remained unchanged at BBB-. From 2009 to 2015, China’s credit-to-GDP soared from about 142 percent to 205 percent and its growth decelerated. The contrast with India’s indicators is striking, which have remained low in range of 70-80.
3. Welfare spending in India suffers from misallocation: as the pair of charts show, the districts with the most poor (in red on the left) are the ones that suffer from the greatest shortfall of funds (in red on the right) in social programs. The districts accounting for the poorest 40% receive 29% of the total funding.
4. India has 7 taxpayers for every 100 voters ranking us 13th amongst 18 of our democratic G-20 peers.
5. India’s share of working age to non-working age population will peak later and at a lower level than that for other countries but last longer. The peak of the growth boost due to the demographic dividend is fast approaching, with peninsular states peaking soon and the hinterland states peaking much later.
Supplementary Readings
A. JAM Trinity
JAM stands for three things – the Jan Dhan Yojana, the Aadhaar initiative of UIDAI and Mobile number. These three things are now often called the Trinity of reforms in India. The JAM Trinity holds the key to one of the biggest pieces of reform ever attempted in India, i.e., direct subsidy transfers. The NDA government is pinning its hopes on these three modes of identification ((JAM) to deliver direct benefits to India’s poor.
Until now, the government has operated a multitude of subsidy schemes to ensure a minimum standard of living for the poor. These take the traditional delivery routes to deliver affordable products or services to them. So, we have the MGNREGA, operated through the panchayats, which pays minimum wages to rural workers. The Centre and States supply rice, wheat, pulses, cooking oil, sugar and kerosene at heavily subsidised prices through the PDS. Then, sectors such as power, fertilisers and oil sell their products to people below market prices. It is natural that such subsidies cost the exchequer quite a bit. Yet, as they make their winding way through the hands of intermediaries, leakages, corruption and inefficiencies eat away large parts.
It is here that the government is quite confident that the three constituents of JAM could be of immense help. With Aadhaar helping in direct biometric identification of disadvantaged citizens and Jan Dhan bank accounts and mobile phones allowing direct transfers of funds into their accounts, it may be possible to cut out all the intermediaries. Thus JAM Trinity has become such an important part of Indian economy that within launch of this terminology it has become immensely popular in financial circles.
To implement the concept of JAM trinity we have to overcome various challenges like lack of infrastructure facilities in terms of access to banking facilities especially in remotest areas, privacy and security issues in ADHAAR.
B. Credit Rating Agencies
Credit rating agencies are whistleblowers. They have expertise in the art of monitoring, evaluation and forecast. They offer information to the investors for taking investment decisions. They help governments to devise policies to avoid imminent crises such as recession, current account deficit, fiscal deficit, other macroeconomic imbalances such as inflation or deflation. They, nevertheless, have to be transparent and accountable. They have to behave with responsibility and caution otherwise they can lead to panic, fear fluctuations in growth, investment and trade. In recent past it has been seen how credit rating agencies were inadequate in telling when sub-prime crisis was building in America, or sovereign debt crisis was building up in Europe.
Reasons for failure
• It was because they failed to maintain their neutrality.
• They also remained motivated by profit motive.
• Conflict of interest
• They joined hands with corporate sector and political bosses to hideously serve their purposes rather than serving the interest of investors in particular and public at large.
• They have lost their trust and respectability and now people are questioning them.
National Investment and Manufacturing Zones
National Investment and Manufacturing Zones:NIMZs
NIMZ is a new concept which is an integral part of the recently approved National Manufacturing Policy of DIPP. The National Manufacturing Policy is a policy solution for a number of challenges discussed in this document, and is a policy tool to be applied to select zones designated for promoting manufacturing.
Key Objectives:
• Creation of dedicated zones for manufacturing in the nation to
• Promote investments in manufacturing
• Make the country a hub for both domestic and international markets
• Promoting ease of development of manufacturing Units
The administrative structure of NIMZ will comprise of a Special Purpose Vehicle, a developer, State Government and the Central Government. The Central Government shall, by notification in the Official Gazette, notify an NIMZ. An SPV will be constituted to exercise the powers conferred on, and discharge the functions assigned to it under this Policy to manage the affairs of the NIMZ. Every SPV shall be a legal entity by the name of the NIMZ. This SPV can be a company, including a Section 25 company depending upon the MOU between stakeholders.
The Major Benefits for Units within NIMZ
• Job-loss policy will enable units to pay suitable worker compensation in the eventuality of business losses/closures through insurance and thereby eliminate the charge on the assets.
• The transfer of assets belonging to a firm which has been declared sick will be facilitated by the SPV of the concerned NIMZ.
• Exemption from capital gains tax.
• Skill up gradation programmes for new employees as well as for the existing employees in coordination with NSDC.
• Soft loans from multilateral institutions will be explored for funding infrastructure development.
• The developers of NIMZs will be allowed to raise ECBs for developing the internal infrastructure.
Special Incentives for Green Technologies in NIMZs
• Environmental audit will be mandatory
• Water audit will be mandatory
• Exemption from water cess
• Ten per cent one-time capital subsidy for units practicing zero water discharge
• Rainwater harvesting will be compulsory
• Under renewable energy appropriate incentives under existing schemes will be available
• Incentive to obtain green rating for buildings
Most Favoured Nation
Most Favoured Nation
The MFN principle of the WTO states that each of the WTO member countries should “treat all the other members equally as ‘most-favoured’ trading partners.”
It leads to equal treatment amongst countries and ensures a more stable, predictable, reliable and competitive international trade.
MFN status is very desirable between trading partners because it allows each country the greatest access into the other’s domestic markets without the hindrances of tariffs or quotas. That means it receives the lowest tariffs, the fewest trade barriers, and the highest import quotas (or none at all). It reduces the ill effects of trade protectionism.
According to WTO the trading system should be:
• Without discrimination – a country should not discriminate between its trading partners (giving them equally “most-favoured-nation” or MFN status); and it should not discriminate between its own and foreign products, services or nationals (giving them “national treatment”);
• Freer – barriers coming down through negotiation;
• Predictable – foreign companies, investors and governments should be confident that trade barriers (including tariffs and non-tariff barriers) should not be raised arbitrarily; tariff rates and market-opening commitments are “bound” in the WTO;
• More competitive – discouraging “unfair” practices such as export subsidies and dumping products at below cost to gain market share; and
• More beneficial for less developed countries – giving them more time to adjust, greater flexibility, and special privileges.
Advantages
MFN status is critically important for smaller and developing countries for several reasons. It gives them access to the larger market. It lowers the cost of their exports since trade barriers are the lowest given. That makes their products more competitive.
The country’s industries have a chance to improve their products as they service this large market. Their companies will grow to meet increased demand. They receive the benefits of economies of scale. That, in turn, increases their exports and their country’s economic growth.
India and MFN
In case of goods, India has extended MFN status to member countries of WTO.
As regards SAARC countries, Bangladesh, Maldives, Nepal, Pakistan and Sri Lanka are members of WTO and except the Pakistan, these countries have extended MFN status to India. India has extended MFN status to all these SAARC countries including Pakistan.
Pradhan Mantri Khanij Kshetra Kalyan Yojana
Pradhan Mantri Khanij Kshetra Kalyan Yojana
The Ministry of Mines has launched Pradhan Mantri Khanij Kshetra Kalyan Yojana (PMKKKY) to provide for the welfare of areas and people affected by mining related operations, using the funds generated by District Mineral Foundations (DMFs).

The Pradhan Mantri Khanij Kshetra Kalyan Yojana rests on three main objectives:
1. To implement various developmental and welfare projects/programs in mining affected areas that complement the existing ongoing schemes/projects of State and Central Government.
2. To minimize/mitigate the adverse impacts, during and after mining, on the environment, health and socio-economics of people in mining districts; and
3. To ensure long-term sustainable livelihoods for the affected people in mining areas.
The PMKKKY has mandated 60% of the funds to be utilized in a for High Priority Areas, such as Drinking water / Environment preservation and pollution control / Health care / Education / Skill development / Welfare of women, children, aged and disabled people / Sanitation and 40% of the funds to be utilized for Infrastructure – Roads & physical infrastructure / Irrigation / Watershed development.
The projects implemented under PMKKKY will help create a congenial mining environment, ameliorate the condition of the affected persons and create a win-win situation for the stakeholders.

No comments:
Post a Comment