
Trade Agreements
Trade Agreements
Trade Agreements
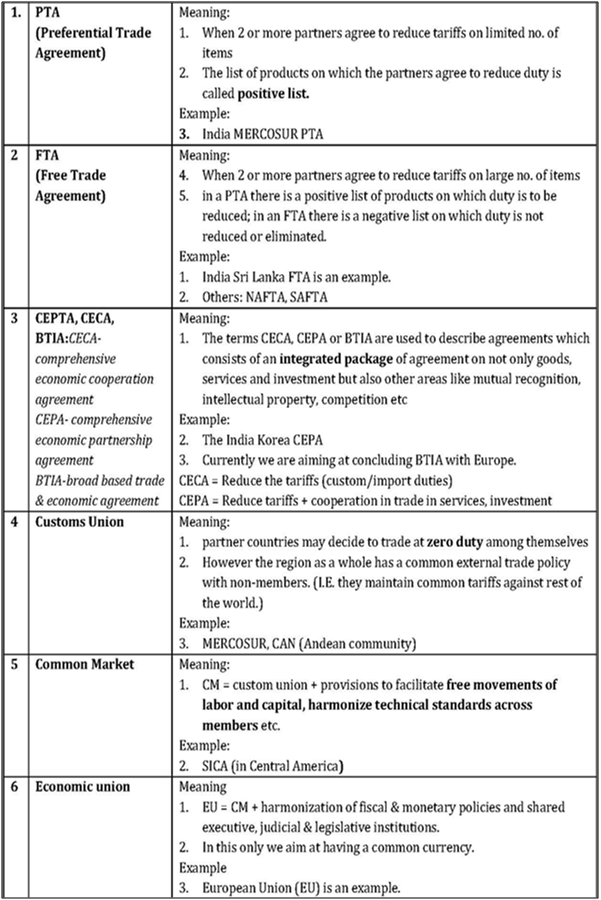
• A trade agreement is an arrangement between two or more countries or trading blocs that primarily agree to reduce or eliminate customs tariff and non-tariff barriers on limited/substantial trade between them. It also includes tax benefits and investment guarantees.
• The most common trade agreements are of the preferential and free trade types in order to reduce (or eliminate) tariffs, quotas and other trade restrictions on items traded between the signatories. Trade Agreements can create opportunities for and help to grow Indian economy.
• India is Member of the WTO which sets out rules governing trade among the member states. India is currently engaged in Doha Development Round of world trade talks, and a strong, market-opening Doha agreement for both goods and services would be an important contribution to addressing the global economic crisis.
• India has trade agreements with many countries which build on the foundation of the WTO Agreement, with more comprehensive and stronger disciplines than the WTO Agreement.
• Many of our trade agreements are bilateral agreements between two governments. But some, like the South Asian Free Trade Agreement (SAFTA), Asia Pacific Trade Agreement (APTA), and the India-ASEAN Trade in Goods Agreement are multilateral agreements among several parties.
• Another important type of trade agreement is the Trade and Investment Framework Agreement (TIFA) which provide frameworks for governments to discuss and resolve trade and investment issues at an early stage. These agreements are also a means to identify and work on capacity-building.
• India also has signed a series of Bilateral Investment Treaties (BITs) help protect private investment, develop market-oriented policies in partner countries, and promote exports.
• There are various stages of economic integration as follows:
a) Preferential Trade Agreement
b) Free Trade Agreement
c) Trade & Economic Partnership
d) Customs Union
e) Common Market
f) Economic Union
b) Free Trade Agreement
c) Trade & Economic Partnership
d) Customs Union
e) Common Market
f) Economic Union
TPP (TRANS-PACIFIC PARTNESHIP) AGREEMENT
Trans-Pacific Partnership agreement among the 12 Pacific Rim nations – which together account for 40% of the world trade – was agreed in October 2015.
What is the Trans-Pacific Partnership (TPP)?
In June 2005, a trade pact, the Trans-Pacific Strategic Economic Partnership Agreement, was signed on the sidelines of Asia-Pacific Economic Cooperation (APEC) Ministers. In January 2008, the US entered into talks with Pacific Rim countries on trade liberalization in financial services that eventually set the stage for the Trans-Pacific Partnership or TPP.
The TPP was broad-based to include 12 Pacific Rim countries. Apart from the US and the four original APEC members, it includes Japan, Malaysia, Vietnam, Australia, Canada, Mexico and Peru. The agreement aims at slashing tariffs on most goods traded between these countries, and the creation of a unified market like in Europe.
Which goods and services have been included?
A full range – tariffs will be removed immediately in some cases, and phased out over time in others. Japanese carmakers like Toyota, Nissan and Honda will benefit from cheaper access to the US, their biggest export market. US vehicle exports too would find new markets if tariffs of up to 70% in countries such as Vietnam and Malaysia are slashed.
US farmers and poultry firms stand to benefit; other foods that would see lower taxes include dairy, sugar, wine, rice and seafood, with exporter countries such as Australia and New Zealand benefitting. Liberalized free trade is likely in services. The challenge for negotiators was to find meeting ground on concerns raised by disparate stakeholders from Canadian dairy farmers to Japanese rice cultivators. An adverse impact could be seen in the biotech sector.
What is the opposition to the deal?
The five-year talks have been largely secret, and campaigners have criticized the lack of transparency. The negotiations focused on keeping China at bay. The TPP will intensify competition between countries’ labour forces. Labour groups are worried it would result in jobs moving from economies such as the US to countries with lower wages and less strict labour laws. Vietnam is being seen as a big winner – analysts predict the deal would boost its growth by over 10% in the next decade – while economies such as Peru might suffer.
How will the larger WTO negotiations be impacted?
WTO negotiations have been plagued by missed deadlines and a lack of consensus. The Doha Development Round is clearly dead, and the outlook for upcoming talks at Nairobi in December is not promising. As a forum, the WTO is clearly crumbling, considering there are two other large regional trade agreements currently under negotiation – the Transatlantic Trade and Investment Partnership (TTIP) between the US and the European Union, and the Regional Comprehensive Economic Partnership (RCEP) between the Association of Southeast Asian Nations (ASEAN) and its six free-trade partners, including China and India.
What can be the impact of the TPP on India?
Pacts like the TPP and TTIP could erode the demand for Indian products in traditional markets such as the US and EU, benefitting the partners to these agreements. Vietnam is expected to gain at the expense of India in the garments business in the US market, as it will have zero-duty access to the US for textiles as against the 14-30% duties that Indian exporters will have to pay.
Recent news
USA has formally abandoned the ambitious, 12-nation Trans-Pacific Partnership brokered by his predecessor and declared an end to the era of multinational trade agreements that defined global economics for decades.
REGIONAL COMPREHENSIVE COMPREHENSIVE ECONOMIC PARTNERSHIP (RCEP)
What is RCEP?
Regional Comprehensive Economic Partnership (RCEP) is a proposed Free Trade Agreement (FTA) between the 10 member states of the Association of Southeast Asian Nations (ASEAN) (Brunei, Burma (Myanmar), Cambodia, Indonesia, Laos, Malaysia, the Philippines, Singapore, Thailand, Vietnam) and the six states with which include India, China, Australia, Japan, South Korea and New Zealand.
RCEP countries have a total population of more than 3 billion, a total GDP of around USD 23 trillion, and they account for about 27% of global trade and 55% of our goods exports.
The RCEP is envisaged to be a modern, comprehensive, high-quality and mutually beneficial economic partnership agreement.
What are the objectives of RCEP?
Guiding Principles and Objectives for Negotiating the Regional Comprehensive Economic Partnership are trade in goods, trade in services, investment, economic and technical cooperation, intellectual property, competition, and dispute settlement.
Significance of RCEP for India
• From India’s point of view, the RCEP presents a decisive platform which could influence its strategic and economic status in the Asia-Pacific region and bring to fruition its Act East Policy. The RCEP agreement would complement India’s existing FTAs with the ASEAN and some of its member countries, as it would deals with Japan and South Korea.
• India is not a party to two important regional economic blocs: the Asia-Pacific Economic Cooperation and the Trans-Pacific Partnership. The RCEP would enable India to strengthen its trade ties with Australia, China, Japan and South Korea, and should reduce the potential negative impacts of TPP and TTIP on the Indian economy.
• RCEP will facilitate India’s integration into sophisticated “regional production networks” that make Asia the world’s factory. The RCEP is expected to harmonize trade-related rules, investment and competition regimes of India with those of other countries of the group. Through domestic policy reforms on these areas, this harmonization of rules and regulations would help Indian companies plug into regional and global value chains and would unlock the true potential of the Indian economy. There would be a boost to inward and outward foreign direct investment, particularly export-oriented FDI.
• India enjoys a comparative advantage in areas such as ICT, IT-enabled services, professional services, healthcare, and education services. In addition to facilitating FDI, the RCEP will create opportunities for Indian companies to access new markets. This is because the structure of manufacturing in many of these countries is becoming more and more sophisticated, resulting in a “servicification” of manufacturing.
• India is well placed to contribute to other countries in RCEP through its expertise in services, not only consolidating the position of the region as the world’s factory but also developing it as the world’s hub for services.
• India may emerge as an attractive investment destination for China. To offset the increasing labour costs, Chinese firms have been relocating labour-intensive manufacturing to Vietnam, Cambodia, Thailand and Indonesia.
• By setting up manufacturing joint ventures in India, China can effectively reach India’s domestic market and also a large European market once India signs an FTA with the European Union. If this story plays out, India’s trade deficit with China will come down as well.
SAFTA
The South Asian Free Trade Area (SAFTA) is an agreement reached on 6 January 2004 at the 12th SAARC summit in Islamabad, Pakistan. It created a free trade area of 1.6 billion people in Afghanistan, Bangladesh, Bhutan, India, Maldives, Nepal, Pakistan and Sri Lanka (as of 2011, the combined population is 1.8 billion people).
The purpose of SAFTA is to encourage and elevate common contract among the countries such as medium and long term contracts. Contracts involving trade operated by states, supply and import assurance in respect of specific products etc. It involves agreement on tariff concession like national duties concession and non-tariff concession.
The objective of the agreement is to promote competition in the area and to provide equitable benefits to the countries involved. It aims to benefit the people of the countries by bringing transparency and integrity among the nations. SAFTA was also formed in order to increase the level of trade and economic cooperation among the SAARC nations by reducing the tariff and barriers and also to provide special preference to the Least Developed Countries (LDCs) among the SAARC nations.
Economic Survey Chapter – 13 & 14
The 'Other India's': Two Analytical Narratives (Redistributive and Natural Resources) on States' Development From Competitive Federalism to Competitive Sub-Federalism: Cities as Dynamos
The ‘Other India’s’: Two Analytical Narratives on States’ Development- Economic Survey Chapter – 13 & 14
ContextThis chapter examines whether the pathologies associated with foreign aid and natural resources also affect the Indian states.
The Indian growth take-off since 1980 is associated with Peninsular India being close to the ocean–which development experience has long confirmed as conferring special advantages. These states-Gujarat, Maharashtra, Tamil Nadu, Karnataka, Kerala, and Andhra Pradesh-have indeed grown faster and advanced more rapidly economically. As a result, they have also been a greater focus of policy and research attention in comparison to other states- the so called ‘Other Indias’. These states include not just hinterland India (the India of rivers) but also the India of forests, of natural resources, and of ‘Special Category’ status. This chapter is devoted to those states that have not been at the mainstream of India’s development narrative. But the analysis is conducted through the lens of broader development experience.
Successful Peninsular India has offered three interesting and different models of development: the traditional East Asian mode of escape from development based on manufacturing (Gujarat and Tamil Nadu); the remittance-reliant mode of development exemplified by Kerala; and the distinctive, “Precocious India” model based on specializing in skilled services (Karnataka, Andhra Pradesh and Tamil Nadu.
Technical Terms
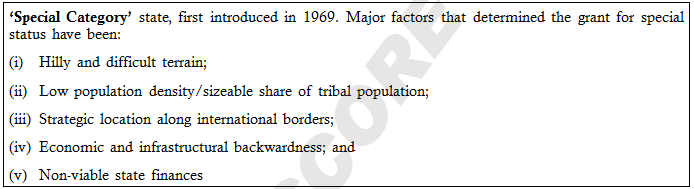
A. ‘Special Category’ state: The concept of a ‘Special Category’ state, first introduced in 1969, sought to provide disadvantaged states (those, due to several factors, were unable to generate enough resources for development) with preferential treatment in the form of central assistance and tax breaks. The states of Assam, Nagaland Arunachal Pradesh, Himachal Pradesh, Manipur, Meghalaya, Mizoram, Sikkim, Tripura, Uttarakhand and Jammu & Kashmir were given special status. Major factors that determined the grant for special status have been: (i) hilly and difficult terrain; (ii) low population density/sizeable share of tribal population; (iii) strategic location along international borders; (iv) economic and infrastructural backwardness; and (v) non-viable state finances.
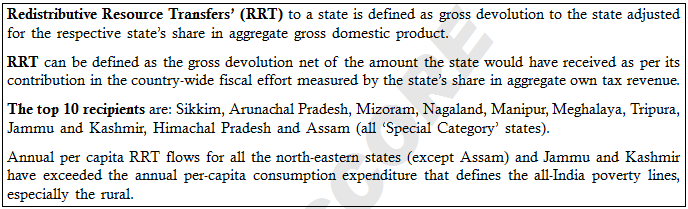
B. ‘Redistributive Resource Transfers’ (RRT) to a state is defined as gross devolution3 to the state adjusted for the respective state’s share in aggregate gross domestic product (definition D1). This adjustment is made to ensure that only the portion of resources devolved to the states over and above their contribution to Gross Domestic Product is included as RRT.
Gist of Economic Survey Chapter
In India peninsular states, also having coastal boundary followed the three different model of development i.e. the traditional East Asian mode of escape from development based on manufacturing (Gujarat and Tamil Nadu); the remittance-reliant mode of development exemplified by Kerala; and the distinctive, “Precocious India” model based on specializing in skilled services (Karnataka, Andhra Pradesh and Tamil Nadu).
However, other states (hinterland India, India of forest and natural resources and of special categories status) have been less successful. This chapter analyse the model of development of other states i.e. those based on “aid” or special status, and those based on natural resources. The “aid” model is most applicable to the erstwhile ‘Special Category’ states that include North-eastern states and Jammu and Kashmir; the natural resources model to Jharkhand, Chhattisgarh, Odisha, Gujarat, and Rajasthan.
However, other states (hinterland India, India of forest and natural resources and of special categories status) have been less successful. This chapter analyse the model of development of other states i.e. those based on “aid” or special status, and those based on natural resources. The “aid” model is most applicable to the erstwhile ‘Special Category’ states that include North-eastern states and Jammu and Kashmir; the natural resources model to Jharkhand, Chhattisgarh, Odisha, Gujarat, and Rajasthan.
Impact of Redistributive Resources
Development model based on foreign aid has not been successful internationally, hypothesis which explains it that aid perpetuates resource dependency, in the sense that since revenues flow in from outside, recipient countries may fail to develop their own tax bases or their institutions more generally. And it is institutions, tax revenues, and incentives that have been found to be critical for growth, much more than overall resource availability.
Though India itself did not followed this model and tried to rely on its resources as much as possible, with the aim of winding down its aid dependence as quickly as possible, however within India, It has provided extensive transfers to certain poorer states in an attempt to spur their development.
Redistributive Resource Transfers: Evidence from Indian States
State governments up to now have received funds from the Centre via different channels: (i) a share of central taxes, as stipulated by Finance Commissions; (ii) plan and non-plan grants; and (iii) plan and non-plan loans and advances. These funds constitute “gross devolution to states” and the entire amount is not “aid”. Gross devolution entails a strong redistributive element. The ‘Special Category’ states have been heavily dependent on such flows for their developmental needs vis-à-vis other states.
• The perspective utilized in this chapter does recognize that transfer of resources to states is done to avert regional inequalities and correct fiscal imbalances and is therefore extremely crucial.
• In this light, this chapter utilizes the concept of ‘Redistributive Resource Transfers’ (RRT). RRT to a state is defined as gross devolution to the state adjusted for the respective state’s share in aggregate gross domestic product. Thus RRT is not identical to gross devolution. This adjustment is made to ensure that only the portion of resources devolved to the states. Over and above their contribution to Gross Domestic Product is included as RRT. RRT is one specific measure of transfers, and is not a definitive metric of redistribution.
• The relationship between RRT, gross devolution to per capita GSPD, per capita expenditure is analysed. It is found that poorer states receive the highest transfers, exactly as one would expect. However, despite such flows over the past few decades most of the high RRT recipient states (excluding Himachal Pradesh and Uttarakhand) are at lower levels of per capita GSDP. The higher the RRT, The slower is growth, the smaller is the share of manufacturing in GSDP, The lower its own tax revenues.
Even on part of quality of governance, The RRT found negative relationship.
Impact of Natural Resources
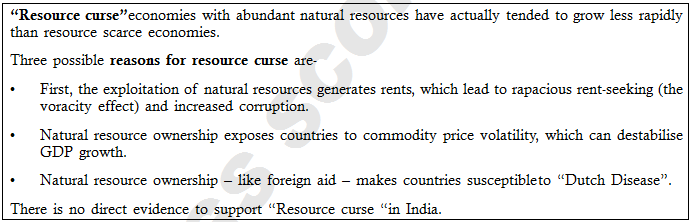
• Initially, economists saw natural resources as a way out of the low saving-low capital development trap, however it was found the that economies with abundant natural resources have actually tended to grow less rapidly than resource scarce economies. Economic geographer Richard Auty coined the phrase “resource curse” in 1993 to describe this phenomenon.
• Three possible explanations were provided for it first, the exploitation of natural resources generates rents, which lead to rapacious rent-seeking (the voracity effect) and increased corruption. Second, natural resource ownership exposes countries to commodity price volatility, which can destabilise GDP growth.
• Finally, natural resource ownership – like foreign aid — makes countries susceptible to “Dutch Disease” named after the impact that discovery of natural gas in the North Sea had on the domestic economy in the Netherlands. This windfall caused the real exchange rate to appreciate as the extra income was spent domestically, pushing up the price of non tradables, such as services geared to the local economy. The higher prices for services then eroded profitability in export and import-competing industries, de-industrialising the economy, with the share of manufacturing in the economy falling. Similar effects have occurred in Canada, Australia, Russia, and Africa.
• This approach can also be applied to some Indian states which were bifurcated in 2000 – Chhattisgarh was split off from Madhya Pradesh, Uttarakhand from Uttar Pradesh, and Jharkhand from Bihar. In this process, mineral wealth was reallocated in favour of the newly created states (nearly all of Bihar’s mineral wealth going to Jharkhand; for example), creating a natural experiment that can be studied profitably.
Natural Resources and Evidence from Indian States
For this purpose, the share of minerals (in value terms) per capita in 2014, the value of minerals is the sum total of fuels (coal, lignite, crude petroleum [onshore only] and natural gas), all metallic minerals, non-metallic minerals as well as other minor minerals are considered. As per this definition the mineral resource rich states are: Jharkhand, Chhattisgarh, Odisha, Rajasthan and surprisingly Gujarat.
• On analysing the relationship between availability of resources and reduction in poverty in mineral rich states compared to other it was found that the mineral rich states seem relatively successful. Their poverty ratio fell by around 31 percentage points over nearly two decades, compared with 28.5 percentage points in the other states however the gains were not passed on equally to all sections of the population. In particular, the Scheduled Tribes (ST) population of the mineral-rich states, which actually forms the predominant population in these areas, saw only a 17 percentage point decline in poverty, smaller than the 22 percentage point fall in the other states.
• Based on the analysis, there seems to be no concrete evidence either in favour or against a “resource curse” in the context of Indian states. The results are, however, relatively strong for levels of per capita GSDP and consumption. With regards to manufacturing share and governance, even though there is no negative correlation, it must be emphasized that there is no strong positive relation either. This implies that the resource rich states need to bolster efforts to counter any possible downsides of a “resource curse” that may emerge in the future.
Conclusion
It is, of course, possible, that the “RRTcurse” and “natural resource curse”, to theextent they are valid, could be a result ofpoor connectivity in particular and poorinfrastructure – physical, financial, and digitalingeneral that most of these states suffer from. This is clearly true of the north-east but also true of many parts of resource-rich India. Enhancing connectivity – financial and physical – on a war footing (as the government has attempted for financial inclusion with the Pradhan Mantri Jan Dhan Yojana (PMJDY), expediting the optical fibre network, etc.) will have a moderating effect.
Some important policy recommendation can be a number of factors that can be taken in the account while determining the quantum and architecture of redistributive resource flows to the states. In the spirit of cooperative federalism these proposals can be suitably modified to address the priorities and concerns of various states. For example
• Redirecting flows to households as part of a Universal Basic Income (UBI) scheme,
• Conditioning transfers on fiscal performance as recommended by 13th FC
• Making governance- contingent transfers.
On part of natural resource revenue, there is a need to improve governance, to ensure a more productive use of the resources, especially in the states that are relying so heavily on them. The structure of revenue administration as it stands today is such that the government receives royalty from the mining of mineral resources. However, in the present system there is further scope to bolster citizen engagement in sharing the fruits of resource extraction. Robust mechanisms of citizen engagement will act as a constraint on large scale corruption and over-exploitation of resources.
Establishment of a trust, to be called the District Mineral Foundation (DMF) for districts affected by mining related operation, a dedicated Fund to which all mining revenue must accrue and an alternative structure to redistribute the gains from resource use directly into the accounts of the concerned citizens as part of a UBI can be the ways for better redistribution.
Supplementary Readings
A. Special category status to states: Meaning and demand
The concept of a special category state was first introduced in 1969 when the 5th Finance Commission sought to provide certain disadvantaged states with preferential treatment in the form of central assistance and tax breaks. Initially three states Assam, Nagaland and Jammu & Kashmir were granted special status but since then eight more have been included (Arunachal Pradesh, Himachal Pradesh, Manipur, Meghalaya, Mizoram, Sikkim, Tripura and Uttarakhand). The rationale for special status is that certain states, because of inherent features, have a low resource base and cannot mobilize resources for development.
The concept of a special category state was first introduced in 1969 when the 5th Finance Commission sought to provide certain disadvantaged states with preferential treatment in the form of central assistance and tax breaks. Initially three states Assam, Nagaland and Jammu & Kashmir were granted special status but since then eight more have been included (Arunachal Pradesh, Himachal Pradesh, Manipur, Meghalaya, Mizoram, Sikkim, Tripura and Uttarakhand). The rationale for special status is that certain states, because of inherent features, have a low resource base and cannot mobilize resources for development.
The criteria for granting special status are as follows:
Some of the features required for special status are: (i) hilly and difficult terrain; (ii) low population density or sizeable share of tribal population; (iii) strategic location along borders with neighbouring countries; (iv) economic and infrastructural backwardness; and (v) non-viable nature of state finances. The decision to grant special category status lies with the National Development Council, composed of the Prime Minster, Union Ministers, Chief Ministers and members of the Planning Commission, who guide and review the work of the Planning Commission.
The special category states have some distinct characteristics. They have international boundaries, hilly terrains and have distinctly different socio-economic developmental parameters. These states have also geographical disadvantages in their effort for infrastructural development. Public expenditure plays a significant role in the Gross State Domestic Product of the states. The states in the North-East are also late starters in development. In view of the above problems, central government sanctions 90 percent in the form of grants in plan assistance to the states in special category. The most important prescription for special category states is interest free loan with rationalization of public expenditure based on growth enhancing sectoral allocation of resources.
Advantages of getting special category status
• Preferential treatment in federal assistance and tax break.
• Significant excise duty concessions. Thus, these states attract large number of industrial units to establish manufacturing facilities within their territory leading to their economy flourishing.
• The special category states do not have a hard budget constraint as the central transfer is high.
• These states avail themselves of the benefit of debt swapping and debt relief schemes (through the enactment of Fiscal Responsibility and Budget Management Act) which facilitate reduction of average annual rate of interest.
• Significant 30% of the Centre’s gross budget goes to the Special category state.
• In centrally sponsored schemes and external aid special category states get it in the ratio of 90% grants and 10% loans. For the rest of the states as per the recommendations of the 12th Finance Commission, in case of centrally sponsored schemes only 70% central funding is there in the form of grant. The rest of the states receive external aid in the exact ratio (of grants and loans) in which it is received by the Center.
Following the constitution of the NITI Aayog and the recommendations of the Fourteenth Finance Commission (FFC), Central plan assistance to SCS States has been subsumed in an increased devolution of the divisible pool to all States. The FFC also recommended variables such as “forest cover” to be included in devolution, with a weightage of 7.5 in the criteria and which could benefit north-eastern States that were previously given SCS assistance. Besides, assistance to Centrally Sponsored Schemes for SCS States was given with 90% Central share and 10% State share.
FCRA
FCRA
Foreign Contribution Regulation Act is a consolidating act whose scope is to regulate the acceptance and utilization of foreign contribution or foreign hospitality by certain individuals or associations or companies and to prohibit acceptance and utilization of foreign contribution or foreign hospitality for any activities detrimental to the national interest and for matters connected therewith or incidental thereto.
Salient features:
• The central government has the power to prohibit any persons or organizations from accepting foreign contribution or hospitality if it is determined that such acceptance would likely “affect prejudicially” (i) the sovereignty and integrity of India, (ii) public interest, (iii) freedom or fairness of election to any legislature, (iv) friendly relations with any foreign State, or (v) harmony between religious, racial, social, linguistic or regional groups, castes or communities.
• The focus of the Act is to ensure that the foreign contribution and foreign hospitality is not utilized to affect or influence electoral politics, public servants, judges and other people working the important areas of national life like journalists, printers and publishers of newspapers, etc. The Act also seeks to regulate flow of foreign funds to voluntary organizations with the objective of preventing any possible diversion of such funds towards activities detrimental to the national interest and to ensure that individuals and organizations may function in a manner consistent with the values of the sovereign democratic republic.
• Foreign funds received as fees for service, costs incurred for goods or services in the ordinary course of business, and trade or commerce are excluded from the definition of foreign contribution.
• The Central Bureau of Investigation or any other Government investigating agency that conducts any investigation under the Act shall furnish reports to the Central Government, on a quarterly basis, indicating the status of each case that was entrusted to it, including information regarding the case number, date of registration, date of filing charge sheet, court before which it has been filed, progress of trial, date of judgment and the conclusion of each case.
• In case the foreign contribution is proposed to be transferred to a person who has not been granted a certificate of registration or prior permission by the Central Government, the person concerned may apply for permission to the Central Government to transfer a part of the foreign contribution, not exceeding ten per cent, of the total value of the foreign contribution received. The application shall be countersigned by the District Magistrate having jurisdiction in the place where the transferred funds are sought to be utilised. The District Magistrate concerned shall take an appropriate decision in the matter within sixty days of the receipt of such request from the person. The donor shall not transfer any foreign contribution until the Central Government has approved the transfer.
New provisions
Seeking to promote transparency in dealings with foreign-funded NGOs, the Modi government on Monday notified the amended Foreign Contribution (Regulation) Rules, 2015, that require all FCRA services and transactions to be made online
All applications for registration, grant of prior permission and renewal of registration under FCRA, 2010, will now be accepted online, with fee for various FCRA services to be deposited through a payment gateway.
On its part, the FCRA division of the home ministry will issue digitally signed registration certificates, prior permission sanctions etc to applicants through emails.
On its part, the FCRA division of the home ministry will issue digitally signed registration certificates, prior permission sanctions etc to applicants through emails.
As per the amended FCRA rules, all NGOs registered or granted prior permission under FCRA are now required to upload details of foreign contributions received and utilized by them every three months on their website or the FCRA website, fcraonline.nic.in. TOI had reported this proposed reform on July 27, 2015. The original FCRR draft had kept this periodicity at seven days, which was objected to by many NGOs.
The new FCRA rules ensure that the human interface with foreign-funded NGOs is minimized, with all queries and replies to applicants to be made through emails.
All FCRA designated bank accounts and utilization accounts will now have to be brought on the online platform of public finance management service (PFMS) of controller general of accounts, ministry of finance.

Concept of Resilient Cities
Concept of Resilient Cities
An umbrella term for the planning and design strategies needed in order to help our cities develop the necessary capacity to meet the challenges of the future both Climate Change and Energy Scarcity
Hence a Resilient City is one that has developed capacities to help absorb future shocks and stresses to its social, economic, and technical systems and infrastructures so as to still be able to maintain essentially the same functions, structures, systems, and identity.
Salient features:
• Resilient Cities and neighbourhoods will need to embrace density, diversity and mix of uses, users, building types, and public spaces. Creating resiliency and reducing the carbon footprint of urban development requires us to maximize the active use of space and land. A single use low density residential neighbourhood or suburban business parks, are typically underutilized during long periods of time. A vibrant and sufficiently densely populated urban environment, by contrast, is well used round-the-clock, all days of the week, and during all seasons. This results from a closely knit mix of uses (e.g. offices, residences, coffee shops etc.), with sufficient density, and which are accessible to a diversity of users (e.g. children, youth, seniors, high-income, low-income,etc.). Dense mixed use neighbourhoods also allow for the effective functioning of all types of business, social and cultural activities with very low inputs of energy for transportation and logistics, thus increasing the resilience of these neighbourhoods.
• Resilient cities and neighbourhoods will prioritize walking as the preferred mode of travel, and as a defining component of a healthy quality of life.
• Resilient cities and neighbourhoods will develop in a way that is transit supportive. After walking and cycling, transit is the most sustainable mode of transportation. Resilient cities will need to re-orient their way of thinking, by shifting from car oriented urban patterns (e.g. cul-de-sacs and expressways) to transit oriented urban patterns and developments (e.g. mobility hubs, intensified corridors, and TODs).
• Resilient cities and neighbourhoods will focus energy and resources on conserving, enhancing, and creating strong, vibrant places, which are a significant component of the neighbourhood’s structure and of the community’s identity.
• Resilient communities, will reduce their carbon footprint by ensuring people opt to walk or cycle, instead of using a car. To achieve this, destinations must be accessible within a pleasant walking distance – people should be able and willing to walk from home to work, to school, to shop, to recreate, and to engage the activities of their everyday life. Longer distances should be achievable through transit.
• Resilient cities and neighbourhoods will conserve and enhance the health of natural systems (including climate) and areas of environmental significance, and manage the impacts of climate change.
• Resilient Cities and neighbourhoods will enhance the effectiveness, efficiency and safety of their technical and industrial systems and processes, including their manufacturing, transportation, communications and construction infrastructure and systems to increase their energy efficiency, and reduce their environmental footprint.
• The development of resilient cities and neighbourhoods will require the active participation of community members, at all scales.
• Resilient Cities and neighbourhoods will plan and design for redundancy and durability of their life safety and critical infrastructure systems. Planning and design of these systems will aim for levels of redundancy and durability that are commensurate with the increasing environmental, social, and economic stresses associated with the impacts of climate change and peak oil.
KAYAKALP Council
KAYAKALP Council
KayaKalp, the new innovative council of Railways, had been set up by Railway Minister Suresh Prabhu. This Council is headed by noted Industrialist Shri Ratan Tata.
The objective is to recommend innovative methods and processes for the improvement, betterment and transformation of the state-run rail network.
The council has been setup for the purpose of business re-engineering and introducing a spirit of innovation in Railways.
The Railway Board will work in close cooperation with the Council.
The subsequent meetings of Kayakalp Council gave action plan to transform the state-run rail network, to develop an action plan to reduce the recurring train mishaps, amid concerns over human errors and large-scale vacancies of safety-related posts.
This council will be a standing body and will interact with all stakeholders and other interested parties.
credits: gsscore (all copyrights acknowledged)

No comments:
Post a Comment