
Subsidies
Subsidies
Subsidies
Definition
• Subsidy has been defined as the “money granted by state, public body, etc., to keep down the prices of commodities, etc.”
• A subsidy is a grant or other financial assistance given by one party for the support or development of another.
• Subsidies affect the economy through the commodity market by lowering the relative price of the subsidized commodity, thereby generating an increase in its demand.
• Taxes appear on the revenue side of government budgets, and subsidies appear on the expenditure side.
• While taxes reduce disposable income, subsidies inject money into circulation.
• Subsidies have been advocated for redistributive objectives, especially to ensure minimum level of food and nutrition to all sections of society.
• Subsidies are justified in the presence of positive externalities (social benefits above private benefits), because in these cases consideration of social benefits would require higher level of consumption than what would be obtained on the basis of private benefits only.
• Primary education, preventive health care, and research and development are prime examples of positive externalities. In these cases, private valuation of the benefits from such goods or services is less than their true value to society.
Types of subsidies
1. Direct Subsidies – Direct subsidies are given in terms of cash grants, interest-free loans and direct benefits. For example- Direct farm subsidies are the kinds of subsidies in which direct cash incentives are paid to the farmers in order to make their products more competitive in the global markets. Direct farm subsidies are helpful as they provide a purchasing power to the farmer and can significantly help in raising the standards of living of the rural poor.
1. Direct Subsidies – Direct subsidies are given in terms of cash grants, interest-free loans and direct benefits. For example- Direct farm subsidies are the kinds of subsidies in which direct cash incentives are paid to the farmers in order to make their products more competitive in the global markets. Direct farm subsidies are helpful as they provide a purchasing power to the farmer and can significantly help in raising the standards of living of the rural poor.
2. Indirect subsidies – Indirect subsidies are provided in terms of tax breaks, insurance, low-interest loans, depreciation write-offs, rent rebates. For example- Indirect farm subsidies: These are the farm subsidies which are provided in the form of cheaper credit facilities, farm loan waivers, reduction in irrigation and electricity bills, fertilizers, seeds and pesticides subsidy as well as the investments in agricultural research, environmental assistance, farmer training etc.
The benefits of subsidy as a policy are:
1. Inducing higher consumption/production.
2. Achievement of social policy objectives including redistribution of income, population control etc.
3. It helps in controlling the prices to maintain stability.
4. Especially in case of agriculture where food is basic right of all, you cannot leave everything to market.
5. Offsetting market imperfections including internalization of externalities.
SUBSIDIES TO AGRICULTURE SECTOR
(1) Input Subsidies: Subsidies can be granted through distribution of inputs at prices that are less than the standard market price for these inputs. The magnitude of subsidies will therefore be equal to the difference between the two prices for per unit of input distributed. Naturally several varieties of subsidies can be named in this category
(1) Input Subsidies: Subsidies can be granted through distribution of inputs at prices that are less than the standard market price for these inputs. The magnitude of subsidies will therefore be equal to the difference between the two prices for per unit of input distributed. Naturally several varieties of subsidies can be named in this category
(a) Fertilizer Subsidy:
• It includes Distribution of cheap chemical or non-chemical fertilizers among the farmers. It amounts to the difference between price paid to manufacturer of fertilizer (domestic or foreign) and price, received from farmers.
• This subsidy ensures:
– Cheap inputs to farmers,
– Reasonable returns to manufacturer,
– Stability in fertilizer prices, and
– Availability of fertilizers to farmers.
• In some cases this kind of subsidies are granted through lifting the tariff on the import of fertilizers, which otherwise would have been imposed.
(b) Irrigation Subsidy:
• Subsidies to the farmers which the government bears on account of providing proper irrigation facilities.
• Irrigation subsidy is the difference between operating and maintenance cost of irrigation infrastructure in the state and irrigation charges recovered from farmers.
• This may work through provisions of public goods such as canals, dams which the government constructs and charges low prices or no prices at all for their use from the farmers.
• It may also be through cheap private irrigation equipment such as pump sets.
(c) Power Subsidy:
• The electricity subsidies imply that the government charges low rates for the electricity supplied to the farmers. Power is primarily used by the farmers for irrigation purposes. It is the difference between the cost of generating and distributing electricity to farmers and price received from farmers.
• The electricity subsidies imply that the government charges low rates for the electricity supplied to the farmers. Power is primarily used by the farmers for irrigation purposes. It is the difference between the cost of generating and distributing electricity to farmers and price received from farmers.
(d) Seed Subsidies:
• High yielding seeds can be provided by the government at low prices. The research and development activities needed to produce such productive seeds are also undertaken by the government, the expenditure on these is a sort of subsidy granted to the farmers.
• High yielding seeds can be provided by the government at low prices. The research and development activities needed to produce such productive seeds are also undertaken by the government, the expenditure on these is a sort of subsidy granted to the farmers.
(e) Credit Subsidy:
• It is the difference between interest charged from farmers, and actual cost of providing credit, plus other costs such as write-offs bad loans. Availability of credit is a major problem for poor farmers. They are cash strapped and cannot approach the credit market because they do not have the collateral needed for loans. To carry out production activities they approach the local money lenders.
• It is the difference between interest charged from farmers, and actual cost of providing credit, plus other costs such as write-offs bad loans. Availability of credit is a major problem for poor farmers. They are cash strapped and cannot approach the credit market because they do not have the collateral needed for loans. To carry out production activities they approach the local money lenders.
(2) Price Subsidy
• It is the difference between the price of food-grains at which FCI procures food-grains from farmers, and the price at which PCI sells either to traders or to the PDS.
• The market price may be so low that the farmers will have to bear losses instead of making profits. In such a case the government may promise to buy the crop from the farmers at a price which is higher than the market price.
• The difference between the two prices is the per unit subsidy granted to the farmers by the government. The price at which the government buys crops from the farmers is called the procurement price.
• Such procurement by the government also has a long run impact. It encourages the farmers to grow crops which are regularly procured.
(3) Infrastructural Subsidy
• Private efforts in many areas do not prove to be sufficient to improve agricultural production. Good roads, storage facilities, power, information about the market, transportation to the ports, etc. are vital for carrying out production and sale operations.
• These facilities are in the domain of public goods, the costs of which are huge and whose benefits accrue to all the cultivators in an area.
• The government takes the responsibility of providing the public goods and given the condition of Indian farmers a lower price can be charged from the poorer farmers.
(4) Export Subsidies
• This type of subsidy is not different from others. But its purpose is special. When a farmer or exporter sells agricultural products in foreign market, he earns money for himself, as well as foreign exchange for the country. Therefore, agricultural exports are generally encouraged as long as these do not harm the domestic economy. Subsides provided to encourage exports are referred as export subsidies.
• This type of subsidy is not different from others. But its purpose is special. When a farmer or exporter sells agricultural products in foreign market, he earns money for himself, as well as foreign exchange for the country. Therefore, agricultural exports are generally encouraged as long as these do not harm the domestic economy. Subsides provided to encourage exports are referred as export subsidies.
Objectives of Agricultural Subsidy
• Economic objectives:
– Stimulate agricultural production.
– Compensate for high costs of transport from port or factory to farms that raise costs of inputs.
– Improve soil quality and combat soil degradation (in the case of fertilizer).
– Make inputs affordable to farmers who cannot buy them, owing to poverty, lack of access to credit, and inability to insure against crop losses.
– Learning — to allow farmers to try novel inputs and become familiar with their advantages.
• Social objectives:
– Social equity – to transfer income to farmers who are poor, live in remote disadvantaged areas, or both
– Social equity – to transfer income to farmers who are poor, live in remote disadvantaged areas, or both
WTO and Agricultural Subsidies
The WTO Agreement on Agriculture (AoA), 1995 permitted the developed countries to continue to provide farm subsidies, but under certain restrictions. In WTO terminology, agricultural subsidies have been segregated into various ‘boxes’:
The WTO Agreement on Agriculture (AoA), 1995 permitted the developed countries to continue to provide farm subsidies, but under certain restrictions. In WTO terminology, agricultural subsidies have been segregated into various ‘boxes’:
1. Green Box subsidies – It includes amounts spent on research, disease control, and infrastructure and food security. These also include direct payments made to farmers such as income support that do not stimulate production. These are not considered trade distorting and are encouraged.
2. Blue Box subsidies – It includes direct payments to farmers to limit production and certain government assistance to encourage agriculture and rural development in developing countries. Blue Box subsidies are seen as being trade distorting.
3. Amber Box subsidies – It includes all agricultural subsidies that do not fall into either blue or green boxes. These include government policies of Minimum support Prices (MSP) for agricultural products or any help directly related to production quantities (e.g. power, fertilizer, seeds, pesticides, irrigation, etc.). These are subject to reduction commitment to the de-minimus level of agricultural outputs- to 5% for developed and 10% for developing countries. India insisted that developed countries should first dismantle their agricultural subsidy structure before asking developing countries to open up their market for farm imports.
FERTILIZER SUBSIDY
• Urea is highly subsidized for Indian Farmers.
• However, the skewed subsidy regime, resulting in farmers paying lesser for urea compared to phosphorus and potassium, had led to urea overuse.
• India purchases about 50 lakh metric tonnes of excess urea, leading to farmers and the government wastefully spend Rs. 2,680 crore and Rs. 5,860 crore respectively, further putting constraint on government’s resources.
• The distorted policy has also led to stagnation of private investment in the sector, especially in urea, and increased reliance on imports. The fertilizer subsidy hurts everyone — farmers, firms, taxpayers and consumers.
FUEL SUBSIDIES IN INDIA
• Selling fuel at less than market prices result in under-recoveries for Oil Marketing Companies (OMCs) like Indian Oil Corporation Ltd (IOCL), Bharat Petroleum Corporation Ltd (BPCL) and Hindustan Petroleum Corporation Ltd (HPCL).
• Govt compensates these OMCs by directing upstream oil companies like Oil and Natural Gas Corporation Ltd (ONGC), Oil India Ltd (OIL), GAIL India Ltd to provide discount on crude oil purchases by these companies and issuing oil bonds. The government has over the years ensured that OMCs remain profitable and honour their financial obligations.
• Subsidies on kerosene have increased from Rs. 12.92/litre to Rs. 34.80/litre and LPG cylinders from Rs. 175.04/cylinder to Rs. 522.10/cylinder during the same period. Diesel accounts for 45%, LPG 33% and kerosene 22% of the total under-recoveries. To rein in subsidies, petrol prices were de-controlled in June 2012. However, it did not have a significant impact on under recoveries because petrol accounts for only 10% of total petroleum product consumption in the country.
FOOD SUBSIDY – NATIONAL FOOD SECURITY ACT
• To ensure food security at the individual or household level, the Government of India implements various schemes in partnership with State Governments and Union Territory Administrations.
• The Government is implementing the Targeted Public Distribution system (TPDS) under which food-grains at subsidized rates are provided to Below Poverty Line and Above Poverty Line Households through a network of more than 5 lakh fair price shops spread across the country.
• Currently, allocations of subsidized food-grains is being made for about 6.5 crore BPL households.
• Besides, Government is also implementing schemes to specifically address the concerns related to malnutrition, especially among women and children, through schemes like Integrated Child Development Services, Mid-Day Meal, Annapurna, etc.
Some of the major highlights of the Food Security Bill are:
• Up to 75% of the rural population (with at least 46% from priority category) and up to 50% of urban population (with at least 28% from priority category) are to be covered under Targeted Public Distribution System.
• 7 kg of food-grains per person per month to be given to priority category households which include rice, wheat and coarse grains at Rs. 3, 2, and 1 per kg, respectively.
• At least 3 kg of food-grains per person per month to be given to general category households, at prices not exceeding 50% of Minimum Support Price.
• Women to be made head of the household for the purpose of issue of ration cards.
• Maternity benefit to pregnant women and lactating mothers.
• End-to-end computerization of Targeted Public Distribution System.
• Three-tier independent grievance redressal mechanism.
• Social audit by local bodies such as Gram Panchayats, Village Councils etc.
• Meals for special groups such as destitute, homeless persons, emergency/disaster affected persons and persons on the verge of starvation.
Targeted Public Distribution System (TPDS)
• In June 1997, the Government of India launched the Targeted Public Distribution System (TPDS) with focus on the poor.
• India’s Public Distribution System (PDS) with a network of 4.78 Lakh Fair Price Shops (FPS) is perhaps the largest retail system of its type in the world.
• The objectives of PDS are:
– Providing food grains and other essential items to vulnerable sections of the society at reasonable (subsidized) prices
– To put an indirect check on the open market prices of various items and
– To attempt socialization in the matter of distribution of essential commodities
• Under the TPDS, States are required to formulate and implement foolproof arrangements for identification of the poor for delivery of food grains and for its distribution in a transparent and accountable manner at the FPS level.
• The TPDS system today supports over 40 Crore Indians below the poverty line with monthly supply of subsidized food grains. The system also provides gainful employment for 4.78 Lakh Fair Price Shops Owners, their employees and hired labour who work at the FCI and state ware housing godowns.
• PDS also has become a cornerstone of government development policy and is tied to implementation of most rural development programs.
• PDS is also a key driver of public sentiment and is an important and very visible metric of government performance.
• Apart from supplying food grains under the TPDS, other welfare schemes related to food are also executed. They are:
– Mid-Day Meal Scheme
– Wheat Based Nutrition Program (WBNP)
– Scheme For Supply of Foodgrains to SC/ST/OBC Hostels/Welfare Institutions
– Annapurna Scheme
– Sampoorn Gramin Rozgar Yojna (SGRY)
– National Food For Work Program (NFFWP)
– Foodgrains To Adolescent Girls , Pregnant And Lactating Mothers ( AGPLM)
– Village Grain Banks Scheme
– World Food Program
There are many systemic challenges that plague the PDS system today
1. PDS Leakages
a. A large number of families living below the poverty line have not been enrolled and therefore do not have access to ration cards
b. A number of bogus ration cards which do not correspond to real families, exist in the BPL & AAY categories.
c. A number of instances where benefits are being availed in the names of rightfully entitled families without their knowledge.
d. Errors in categorization of families that lead to BPL families getting APL cards and vice versa.
2. Scale and Quality of Issue – The scale of issue and the quality of food grains delivered to the beneficiary is rarely in conformity with the policy. Many FPS are open only for a few days in a month and beneficiaries who do not visit the FPS on these days are denied their right.
3. System Transparency and Accountability –The most serious flaw plaguing the system at present is the lack of transparency and accountability in its functioning.
4. Grievance Redressal Mechanisms – There are numerous entities like Vigilance Committee, Anti-Hoarding Cells constituted to ensure smooth functioning of the PDS system. Their impact is virtually non-existent on the ground and as a result, malpractices abound to the great discomfiture of the common man.
DIRECT CASH TRANSFER
• Recent studies by the Planning Commission have shown that the Public Distribution System has become so inefficient that 58% of the subsidized grains do not reach the targeted group and almost a third of it is siphoned off the supply chain. According to the Finance Ministry the inefficiencies of the PDS ensure that the Government is forced to spend Rs.3.65 for transferring of Rs. 1 to the poor.
• The idea behind the Direct Cash Transfer is to cut down wastage, duplication and leakages and also to enhance efficiency. The idea is to move to a completely electronic cash transfer system for the entire population.
Launch of the programme
• The programme is now called direct benefit transfer (DBT).
• On January 01, 2013, the government of India rolled out the DBT covering seven welfare schemes in 20 districts in 16 states.
• The programme covers schemes like educational scholarship for the Scheduled Castes and the Scheduled Tribes and pensions to widows. Food, fertilizers, LPG, diesel and kerosene have been kept out for the present.
• Among other objectives like better delivery, more accurate targeting, giving broader choice to the beneficiaries, reducing pilferage and corruption, the programme is also aimed at cutting the massive subsidy bill of Rs 1,64,000 crore .
Scope of DBT
• The DBT program aims that entitlements and benefits are transferred directly to the beneficiaries. The beneficiaries could include widows, students and pension takers. This would be done through biometric-based Aadhaar-linked bank accounts. This would reduce several layers of intermediaries and delays in the system.
• The DBT program aims that entitlements and benefits are transferred directly to the beneficiaries. The beneficiaries could include widows, students and pension takers. This would be done through biometric-based Aadhaar-linked bank accounts. This would reduce several layers of intermediaries and delays in the system.
Advantages of DBT system
• The use of Aadhaar or other biometric based systems would dissolve problems like duplicates or ghosts. Duplicates are when the name of the beneficiary is repeated and Ghosts is when the name of a nonexistent beneficiary is mentioned.
• It helps in the quick and direct cash transfer to the intended beneficiary.
• The cash transfer happens through a dense Business Correspondent system on the ground with micro ATM’s.
• This ensures that the poor get the same level of service that the rich and the middle classes in the society receive.
• The financial inclusion offered by the DBT infrastructure can also be used by internal migrants to send their remittances.
• The Aadhaar-based micro-ATM network could ensure that remittances take place instantly and at much lower cost to migrants.
Subsidies and Export Promotion
• As a part of export promotion strategy, besides various other measures, various types of export incentives have been evolved. These have been altered and modified from time to time to meet varying conditions. Broadly, these incentives can be classified into three categories, viz.
• As a part of export promotion strategy, besides various other measures, various types of export incentives have been evolved. These have been altered and modified from time to time to meet varying conditions. Broadly, these incentives can be classified into three categories, viz.
• Fiscal Incentives – Under fiscal incentives, the important measures that have been in vogue are income tax concessions, customs draw-backs, refund of excise duty,- exemption from sales tax, provision for export undertaken, and facility for manufacture under bond.
• Financial Incentives – These incentives refer to the provision of cash assistance for specified export promotional efforts and export facilities.
• Special Incentive Schemes – Besides the recent reforms in the export incentive structure, export profitability was sought to be improved through a variety of fiscal concessions, and explicit and implicit subsidies. These measures were considered necessary to neutralise the negative financial impact of high administered prices of inputs and differential tax incidence that exporters suffer vis-a-vis ‘across the border’ competitors.
Economic Survey Chapter – 8
Review of Economic Development
Review of Economic Development-(Economic Survey Chapter – 8)
Context
The GDP has grown at 7.1 per cent in the first half of the current financial year, as per the estimates released by the Central Statistics Office (CSO). The first advance estimates released in early January 2017 were arrived at mainly based on data prior to demonetisation and largely re?ect the economic situation prevailing in the first seven to eight months of the financial year.
At the sectoral level, growth of agriculture & allied sectors improved significantly in 2016-17, following the normal monsoon in the current year which was preceded by sub-par monsoon rainfall in 2014-15 and 2015-16. The growth in industrial sector, comprising mining & quarrying, manufacturing, electricity, gas & water supply, and construction sectors moderated in 2016-17. This is in tandem with the moderation in manufacturing, mostly on account of a steep contraction in capital goods, and consumer non-durable segments. As in the previous years, the service sector continued to be the dominant contributor to the overall growth of the economy, led by a significant pick-up in public administration, defence & other services, that were boosted by the payouts of the Seventh Pay Commission.
The headline in?ation as measured by the Consumer Price Index (CPI) remained under control for the third successive financial year as a result of lower prices especially of food items. This is because Since July 2016, pulses prices except gram dal prices have been declining owing to near normal monsoon, increase in the Rabi pulses sowing and buffer build up by the Government.
At the monetary front credit growth is the major issue which require solving twin balance sheet problem. Also, RBI has accepted many recommendations of Khan Committee to strengthen corporate bond market.
The trend of negative growth was reversed somewhat during 2016-17 (April-December), with exports registering a growth of 0.7 per cent. Despite moderate growth in exports, India’s external sector position has been comfortable, with the current account deficit (CAD) progressively contracting from US$ 88.2 billion (4.8 per cent of GDP) in 2012-13 to US$ 22.2 billion (1.1 per cent of GDP) in 2015-16. The CAD further narrowed in 2016-17 (H1) to 0.3 per cent of GDP.
The downward spiral in international crude oil prices resulted in a decline in oil import bill by around 18 per cent which together with a sharp decline in gold imports led to a reduction in India’s overall imports. Robust in?ow of foreign direct investment (FDI) and net positive in?ow of foreign portfolio investment (FPI) were sufficient to finance CAD leading to an accretion in foreign exchange reserves.
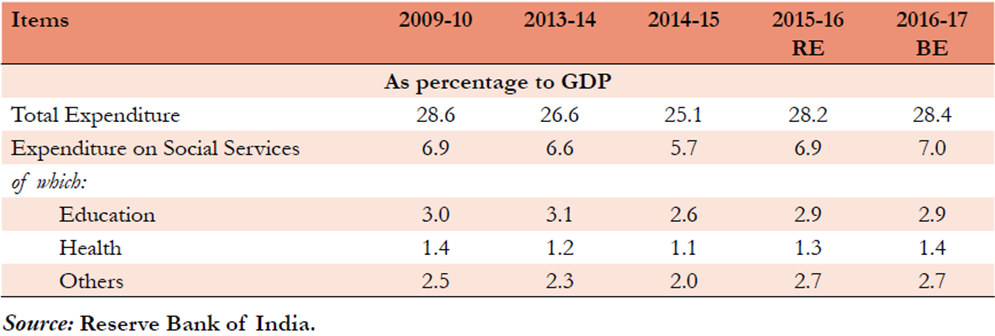
As per the Reserve Bank of India data, expenditure on social services by Centre and States, as a proportion of GDP was 7.0 per cent during 2016-17 (BE), with education and health sectors accounting for 2.9 per cent and 1.4 per cent respectively. There is a clear shift in employment to secondary and tertiary sectors from the primary sector. On the other hand growth in employment re?ects increases in both casual labour and contract workers. Overall, As per EUS Surveys, employment growth has been sluggish. The multiplicity of labour laws and the difficulty in their compliance have been an impediment to the industrial development and employment generation.
An important concern that is often raised in the context of school education is low learning outcomes. This has been pointed out in several studies including ASER, 2014. While there have been improvements in access and retention, the learning outcomes for a majority of children
is still a cause of serious concern. Some of the underlying causes contributing to low quality of education in the primary sector are teacher absenteeism and the shortage of professionally qualified teachers.
However, challenges abound. The investment to GDP ratio has not only been lower than the desirable levels but has been consistently declining over the last few years. This trend needs to be reversed at the earliest in order to realise higher and lasting economic growth. Similarly, the savings rate will have to be raised, so that investment can be financed without resorting to high dose of external financing. After remaining fairly stable for much of the last two years, international prices of crude oil have started to trend up. This along with rise in the prices of other commodities like coal, etc. could exert in?ationary pressure and have the potential to adversely impact the trade and fiscal balances. The outlook for the next financial year suggests that growth is set to recover, as the currency in circulation returns to normal levels and taking into account the significant reform measures initiated by the government.
At the sectoral level, growth of agriculture & allied sectors improved significantly in 2016-17, following the normal monsoon in the current year which was preceded by sub-par monsoon rainfall in 2014-15 and 2015-16. The growth in industrial sector, comprising mining & quarrying, manufacturing, electricity, gas & water supply, and construction sectors moderated in 2016-17. This is in tandem with the moderation in manufacturing, mostly on account of a steep contraction in capital goods, and consumer non-durable segments. As in the previous years, the service sector continued to be the dominant contributor to the overall growth of the economy, led by a significant pick-up in public administration, defence & other services, that were boosted by the payouts of the Seventh Pay Commission.
The headline in?ation as measured by the Consumer Price Index (CPI) remained under control for the third successive financial year as a result of lower prices especially of food items. This is because Since July 2016, pulses prices except gram dal prices have been declining owing to near normal monsoon, increase in the Rabi pulses sowing and buffer build up by the Government.
At the monetary front credit growth is the major issue which require solving twin balance sheet problem. Also, RBI has accepted many recommendations of Khan Committee to strengthen corporate bond market.
The trend of negative growth was reversed somewhat during 2016-17 (April-December), with exports registering a growth of 0.7 per cent. Despite moderate growth in exports, India’s external sector position has been comfortable, with the current account deficit (CAD) progressively contracting from US$ 88.2 billion (4.8 per cent of GDP) in 2012-13 to US$ 22.2 billion (1.1 per cent of GDP) in 2015-16. The CAD further narrowed in 2016-17 (H1) to 0.3 per cent of GDP.
The downward spiral in international crude oil prices resulted in a decline in oil import bill by around 18 per cent which together with a sharp decline in gold imports led to a reduction in India’s overall imports. Robust in?ow of foreign direct investment (FDI) and net positive in?ow of foreign portfolio investment (FPI) were sufficient to finance CAD leading to an accretion in foreign exchange reserves.
As per the Reserve Bank of India data, expenditure on social services by Centre and States, as a proportion of GDP was 7.0 per cent during 2016-17 (BE), with education and health sectors accounting for 2.9 per cent and 1.4 per cent respectively. There is a clear shift in employment to secondary and tertiary sectors from the primary sector. On the other hand growth in employment re?ects increases in both casual labour and contract workers. Overall, As per EUS Surveys, employment growth has been sluggish. The multiplicity of labour laws and the difficulty in their compliance have been an impediment to the industrial development and employment generation.
An important concern that is often raised in the context of school education is low learning outcomes. This has been pointed out in several studies including ASER, 2014. While there have been improvements in access and retention, the learning outcomes for a majority of children
is still a cause of serious concern. Some of the underlying causes contributing to low quality of education in the primary sector are teacher absenteeism and the shortage of professionally qualified teachers.
However, challenges abound. The investment to GDP ratio has not only been lower than the desirable levels but has been consistently declining over the last few years. This trend needs to be reversed at the earliest in order to realise higher and lasting economic growth. Similarly, the savings rate will have to be raised, so that investment can be financed without resorting to high dose of external financing. After remaining fairly stable for much of the last two years, international prices of crude oil have started to trend up. This along with rise in the prices of other commodities like coal, etc. could exert in?ationary pressure and have the potential to adversely impact the trade and fiscal balances. The outlook for the next financial year suggests that growth is set to recover, as the currency in circulation returns to normal levels and taking into account the significant reform measures initiated by the government.
Technical Terms
A. Gross fixed capital formation (GFCF) – It refers to the net increase in physical assets (investment minus disposals) within the measurement period. GFCF is called “gross” because the measure does not make any adjustments to deduct the consumption of fixed capital (depreciation of fixed assets) from the investment figures. It also does not include land purchases. It is a component of expenditure approach to calculating GDP.
B. Base Effect – inflation is calculated taking into account index number for present month and corresponding month in the previous year i.e. index figures for july this year and july last year and not july this year and june this year).

The base effect refers to the impact of the rise in price in the previous year level (i.e. last year’s inflation) over the corresponding rise in price levels in the current year (i.e., current inflation): if the price index had risen at a high rate in the corresponding period of the previous year leading to a high inflation rate, some of the potential rise is already factored in, therefore a similar absolute increase in the Price index in the current year will lead to a relatively lower inflation rates. On the other hand, if the inflation rate was too low in the corresponding period of the previous year, even a relatively smaller rise in the Price Index will arithmetically give a high rate of current inflation.
The base effect refers to the impact of the rise in price in the previous year level (i.e. last year’s inflation) over the corresponding rise in price levels in the current year (i.e., current inflation): if the price index had risen at a high rate in the corresponding period of the previous year leading to a high inflation rate, some of the potential rise is already factored in, therefore a similar absolute increase in the Price index in the current year will lead to a relatively lower inflation rates. On the other hand, if the inflation rate was too low in the corresponding period of the previous year, even a relatively smaller rise in the Price Index will arithmetically give a high rate of current inflation.
C. Liquidity Adjustment Facility (LAF) – Liquidity Adjustment Facility (LAF) is the primary instrument of Reserve Bank of India for modulating liquidity and transmitting interest rate signals to the market. It refers to the difference between the two key rates viz. repo rate and reverse repo rate. Informally, Liquidity Adjustment Facility is also known as Liquidity Corridor.
Under Repo, the banks borrow money from RBI to meet short term needs by putting government securities (G-secs) as collateral (which are not a part of SLR). Under Reverse Repo, RBI borrows money from banks by lending securities. While repo injects liquidity into the system, the Reverse repo absorbs the liquidity from the system. RBI only announces Repo Rate. The Reverse Repo Rate is linked to Repo Rate and is 100 basis points (1%) below repo rate. RBI makes decision regarding Repo Rate on the basis of prevalent market conditions and relevant factors. The tenure of the Repo is seven working days.
Under Repo, the banks borrow money from RBI to meet short term needs by putting government securities (G-secs) as collateral (which are not a part of SLR). Under Reverse Repo, RBI borrows money from banks by lending securities. While repo injects liquidity into the system, the Reverse repo absorbs the liquidity from the system. RBI only announces Repo Rate. The Reverse Repo Rate is linked to Repo Rate and is 100 basis points (1%) below repo rate. RBI makes decision regarding Repo Rate on the basis of prevalent market conditions and relevant factors. The tenure of the Repo is seven working days.
D. Marginal Standing Facility (MSF) – It is a new Liquidity Adjustment Facility (LAF) window created by Reserve Bank of India in its credit policy of May 2011. MSF is the rate at which the banks are able to borrow overnight funds from RBI against the approved government securities (which can be a part of SLR). Overall idea behind the MSF is to contain volatility in the overnight inter-bank rates. Rate of Interest The rate of interest on MSF is above 100 bps above the Repo Rate.
E. Market stabilisation scheme (MSS) bonds – These are special bonds floated on behalf of the government by the RBI for the specific purpose of mop ping up the excess liquidity in the system when regular government bonds prove inadequate. These are mostly shorter-tenure bonds, of less than six months maturity. But the tenure differs depending on the requirement. The sudden surge in deposits due to the surrender of demonetised currency notes in large quantities skews bond yields and interest rates, disrupting the functioning of the market. To impound the excess liquidity, bankers felt MSS bonds were a better option than a hike in CRR holdings.
F. Nominal Effective Exchange Rate – The nominal effective exchange rate (NEER) is an unadjusted weighted average rate at which one country’s currency exchanges for a basket of multiple foreign currencies i.e. It is the value of basket of foreign currencies in terms of Indian rupee. If NEER value is high then other country currency could buy more of Indian products then exports would increase. In economics, the NEER is an indicator of a country’s international competitiveness.
G. Real Effective Exchange Rate – The real effective exchange rate (REER) is the weighted average of a country’s currency relative to an index or basket of other major currencies, adjusted for the effects of inflation.
H. Index of Industrial production – Index of Industrial Production (IIP) measures the quantum of changes in the industrial production in an economy and captures the general level of industrial activity in the country. It is a composite indicator expressed in terms of an index number which measures the short term changes in the volume of production of a basket of industrial products during a given period with respect to the base period. IIP is a short term indicator of industrial growth till the results from Annual Survey of Industries and National Accounts Statistics are available. The base year is always given a value of 100. The current base year for the IIP series in India is 2004-05. So, if the current IIP reads as 116 it means that there has been 16% growth compared to the base year. Index of Industrial Production is compiled and published every month by Central Statistics Office (CSO) of the Ministry of Statistics and Programme Implementation with a time lag of six weeks from the reference month.
I. Emission Intensity of GDP – Emission intensity is the volume of emissions per unit of GDP. Reducing emission intensity means that less pollution is being created per unit of GDP.
J. Green Energy Corridor – The Government in 2013 announced a National Green Corridor Program (NGCP) worth Rs. 43,000 Crore to enable the flow of renewable energy into the National Grid Network. Specifically, the green energy corridor is grid connected network for the transmission of renewable energy produced from various renewable energy projects.
K. National Adaptation Fund on Climate Change (NAFCC) – The National Adaptation Fund on Climate Change (NAFCC) has been established in August 2015 to meet the cost of adaptation to climate change for the State and Union Territories of India that are particularly vulnerable to the adverse effects of climate change. Government has set up a budget provision of Rs.350 crores for the year 2015-16 and 2016-17, with an estimated requirement of Rs.181.5 crores for financial year 2017-18 for NAFCC. The projects under NAFCC prioritize the needs that builds climate resilience in the areas identified under the SAPCC (State Action Plan on Climate Change) and the relevant Missions under NAPCC (National Action Plan on Climate Change).
Gist of Economic Survey Chapter
Indian Economy GDP and GVA growth rate
• As per the first Advance Estimates by CSO, GDP growth rate is estimated at 7.1% in 2016-17.
• The growth in the second half of 2016-17 works out to 7.0 per cent as against 7.2 per cent in the first half. However, estimates of second half are based on the economic situation prior to the demonetisation.

• The growth rate of Gross Value Added (GVA) at constant basic prices for 2016-17 is placed at 7.0 per cent, as against 7.2 per cent in 2015-16.
• The growth in the second half of 2016-17 is estimated at 6.7 per cent as against 7.2 per cent in the first half.
• In various sector, growth in Agriculture and allied sector is estimated at 4% on account of better monsoon compared last two years.
• However, growth in Industrial sector is slowing down on account of moderation in manufacturing mainly due to a steep contraction in capital goods, and consumer non-durable segments of Index of Industrial Production (IIP). Contraction in mining because of slowdown in production of crude oil and gas is also adding to it.
• Growth in service sector would be continued to near 9% led by a significant pick-up in public administration, defence & other services that were boosted by the pay-outs of the Seventh Pay Commission.
• Gross fixed capital formation (GFCF) to GDP ratio (at current prices) is estimated to be 26.6 per cent. Fixed investment rate has been declining since 2011-12. However, the growth in government final consumption expenditure that is the major driver of GDP growth in the current year from the demand side. Import and export both are shrinking.
• As per the first Advance Estimates by CSO, GDP growth rate is estimated at 7.1% in 2016-17.
• The growth in the second half of 2016-17 works out to 7.0 per cent as against 7.2 per cent in the first half. However, estimates of second half are based on the economic situation prior to the demonetisation.
• The growth rate of Gross Value Added (GVA) at constant basic prices for 2016-17 is placed at 7.0 per cent, as against 7.2 per cent in 2015-16.
• The growth in the second half of 2016-17 is estimated at 6.7 per cent as against 7.2 per cent in the first half.
• In various sector, growth in Agriculture and allied sector is estimated at 4% on account of better monsoon compared last two years.
• However, growth in Industrial sector is slowing down on account of moderation in manufacturing mainly due to a steep contraction in capital goods, and consumer non-durable segments of Index of Industrial Production (IIP). Contraction in mining because of slowdown in production of crude oil and gas is also adding to it.
• Growth in service sector would be continued to near 9% led by a significant pick-up in public administration, defence & other services that were boosted by the pay-outs of the Seventh Pay Commission.
• Gross fixed capital formation (GFCF) to GDP ratio (at current prices) is estimated to be 26.6 per cent. Fixed investment rate has been declining since 2011-12. However, the growth in government final consumption expenditure that is the major driver of GDP growth in the current year from the demand side. Import and export both are shrinking.

Fiscal developments
• Fiscal deficit for 2016-17 was projected to be 3.5%,which was sought to be achieved through an 11.9 per cent increase in the gross tax revenue (mainly due to growth in union excise duties and service Tax) and significant strides in non-tax revenue and non-debt capital receipts.
• However, growth in revenue expenditure during April-November 2016, which prima facie seems very high, as the salary component increased by 23.2 on recommendation of the Seventh Pay Commission, a 21.6 per cent surge in food subsidy and an increase of 39.5 per cent in the grants for creation of capital assets (GCCA) during April-November 2016.
• The growth in the total outstanding liabilities of the Union Government remained closely similar during 2014-15 and 2015-16, at 10.1 per cent and 10.4 per cent respectively, yet there was an increase in the ratio of internal debt of the Central Government to GDP in 2015-16 mainly because of decline in nominal GDP on account of sharp decline in inflation.
Inflation
• The headline inflation as measured by the Consumer Price Index (CPI) remained under control for the third successive financial year i.e. 4.8% in 2016-17, 4.9 per cent in 2015-16 and5.9 per cent in 2014-15 mainly due to decline in food items.
• The average inflation based on the wholesale price index (WPI) declined to (-) 2.5per cent in 2015-16 from 2.0 per cent in 2014- 15 however trend reversed in 2016 with average inflation was 2.9 per cent during April- December 2016 mainly due to impact of rise in global commodity prices, energy price and partly owing to adverse base effect.
• The inflation in India is repeatedly being driven by narrow group of food items. Prices of pulses which remain high till mid July 2016 was major contributor to inflation which declined afterward owing to near normal monsoon, increase in the Rabi pulses sowing and buffer build up by the Government.
• However CPI based core inflation (exclusive of food and fuel group) has remained near 4.8% so far during this fiscal year. For the next financial year, the recent uptick in global commodity prices, in particular crude oil prices, pose an upside risk.
Monetary Management and Financial intermediation
• The Government amended the Reserve Bank of India Act, 1934 during the current financial year which provide for inflation target to be set by the Government in consultation with the Reserve Bank, once in every five years and further provides for a statutory basis for the constitution of an empowered Monetary Policy Committee (MPC) to set the policy rates.
• The Government has fixed the inflation target of 4 per cent with tolerance level of +/- 2 per cent for the period beginning from 5th August, 2016 to March 31, 2021.
• The MPC reduced the policy rate by 25 basis points to 6.25 per cent in its first meeting held on October 4, 2016. Hence the reverse repo rate under the Liquidity Adjustment Facility (LAF) remains 5.75 per cent, and the Marginal Standing Facility (MSF) rate is 6.75 per cent.
• The asset quality of banks deteriorated further. The gross non-performing assets (GNPA) to total advances ratio of scheduled commercial banks (SCBs) increased to 9.1 per cent from 7.8 per cent between March and September 2016.
• Non- food credit (NFC) outstanding grew at sub 10 per cent for all the months except for September 2016, Credit growth to industrial sector remained persistently below 1 per cent during the current fiscal, However, bank credit lending to agriculture and allied activities (A&A) and personal loans (PL) segments continue to be the major contributor to overall NFC growth.

India’s Merchandise Trade
• The trend of negative growth was reversed somewhat during 2016-17 (April-December), with exports registering a growth of 0.7 per cent to US$ 198.8 billion from US$ 197.3 billion in 2015-16 mainly due to growth in Non POL (Petroleum, oil and lubricants) exports (April-December).
• Region-wise, India’s exports to Europe, America and Asia increased by 2.6 per cent, 2.4 per cent and 1.1 per cent respectively in 2016-17 (April- November), while exports to Africa declined by 13.5 per cent. USA followed by UAE and Hong Kong were the top export destinations.
• During 2016-17 (April-December) imports declined by 7.4 per cent to US$ 275.4 billion mainly due to decline inPOL imports, Gold and silver and capital goods.
• Top three import destinations of India were China followed by UAE and USA in 2016-17.
• India’s trade deficit declined by 23.5 per cent to US$ 76.5 billion in 2016-17 (April-December) as compared to US$ 100.1 billion in the corresponding period of previous year.
• The Government amended the Reserve Bank of India Act, 1934 during the current financial year which provide for inflation target to be set by the Government in consultation with the Reserve Bank, once in every five years and further provides for a statutory basis for the constitution of an empowered Monetary Policy Committee (MPC) to set the policy rates.
• The Government has fixed the inflation target of 4 per cent with tolerance level of +/- 2 per cent for the period beginning from 5th August, 2016 to March 31, 2021.
• The MPC reduced the policy rate by 25 basis points to 6.25 per cent in its first meeting held on October 4, 2016. Hence the reverse repo rate under the Liquidity Adjustment Facility (LAF) remains 5.75 per cent, and the Marginal Standing Facility (MSF) rate is 6.75 per cent.
• The asset quality of banks deteriorated further. The gross non-performing assets (GNPA) to total advances ratio of scheduled commercial banks (SCBs) increased to 9.1 per cent from 7.8 per cent between March and September 2016.
• Non- food credit (NFC) outstanding grew at sub 10 per cent for all the months except for September 2016, Credit growth to industrial sector remained persistently below 1 per cent during the current fiscal, However, bank credit lending to agriculture and allied activities (A&A) and personal loans (PL) segments continue to be the major contributor to overall NFC growth.
India’s Merchandise Trade
• The trend of negative growth was reversed somewhat during 2016-17 (April-December), with exports registering a growth of 0.7 per cent to US$ 198.8 billion from US$ 197.3 billion in 2015-16 mainly due to growth in Non POL (Petroleum, oil and lubricants) exports (April-December).
• Region-wise, India’s exports to Europe, America and Asia increased by 2.6 per cent, 2.4 per cent and 1.1 per cent respectively in 2016-17 (April- November), while exports to Africa declined by 13.5 per cent. USA followed by UAE and Hong Kong were the top export destinations.
• During 2016-17 (April-December) imports declined by 7.4 per cent to US$ 275.4 billion mainly due to decline inPOL imports, Gold and silver and capital goods.
• Top three import destinations of India were China followed by UAE and USA in 2016-17.
• India’s trade deficit declined by 23.5 per cent to US$ 76.5 billion in 2016-17 (April-December) as compared to US$ 100.1 billion in the corresponding period of previous year.
Balance of Payments
• India’s Current Account Deficit (CAD) progressively contracting from US$ 88.2 billion (4.8 per cent of GDP) in 2012-13 to US$ 22.2 billion (1.1 per cent of GDP) in 2015-16. The CAD further narrowed in 2016-17 (H1) to 0.3 per cent of GDP mainly on account of sharp decline in oil import bill and gold imports.
• There is also decline in remittances because of subdued income conditions in source countries, particularly in the gulf region due to downward spiral in oil prices.
• Despite higher net repayments on overseas borrowings and fall in banking capital (net) with building up of foreign currency assets by banks & decline in NRI deposits (net), robust inflow of foreign direct investment (FDI) and net positive inflow of foreign portfolio investment (FPI) were sufficient to finance CAD leading to an accretion in foreign exchange reserves in H1 of 2016-17.
External debt
• At end-September 2016, India’s external debt stock stood at US$ 484.3 billion, recording a decline of US$ 0.8 billion over the level at end-March 2016, mainly due to a reduction in commercial borrowings and short term external debt.
• The shares of Government (Sovereign) and non-Government debt in the total external debt were 20.1 per cent and 79.9 per cent respectively, at end-September 2016.
• US dollar denominated debt accounted for 55.6 per cent of India’s total external debt at end- September 2016, followed by Indian rupee (30.1 per cent), SDR (5.8 per cent), Japanese Yen (4.8 per cent) Pound Sterling (0.7 per cent), Euro (2.4 per cent) and others (0.6 per cent).
Outlook for the Economy for the year 2017-18
• CSO in its first AE estimated the economy to grow by 7.1 per cent in the current year; however number can be revised downward considering the impact of demonetisation.
• For 2017-18, it is expected that the growth would return to normal i.e. 6¾ per cent to 7½ per cent in 2017-18 as the new currency notes in required quantities come back into circulation and as follow up actions to demonetisation are taken.
• However, the challenges for economy are rising price of crude oil, downward cycle of fixed investment rate, slowdown in global trade and investment flow and hike in fed rate in USA.
Agriculture and Food Management
• Growth rate for the agriculture and allied sectors is estimated to be 4.1 per cent for 2016-17.
• Both production and area sown has increased compared to last year because of good monsoon i.e. 97% rainfall of its long period average (LPA).
• The price policy of Government for major agricultural commodities seeks to ensure remunerative prices to the farmers to encourage higher investment and production, and to safeguard the interest of consumers by making available supplies at reasonable prices.
• To reduce the volatility in pulse prices many measures has been taken on recommendation of a Committee on ‘Incentivising Pulses Production Through Minimum Support Price (MSP) and Related Policies’ was set up under the Chairmanship of Dr. Arvind Subramanian. These include:
1. Procurement and stock of 2 million tons of pulses stock with targets for individual pulses, especially tur (3.5 lakh tonnes) and urad (2 lakh tonnes).
2. Increase in MSP of pulses, production subsidies for farmers to grow pulses in irrigated areas.
3. Eliminate export ban on pulses and stock limits.
4. Encourage states to delist pulses from their APMCs
5. Create a new institution as a Public Private Partnership (PPP) to compete with and complement existing institutions to procure stock and dispose pulses.
6. Encourage development of GM technologies. Grant expeditious approval to indigenously developed new varieties of pulses.
Industrial, Corporate and Infrastructure Sectors
• As per the first advance estimates of the CSO, growth rate of the industrial sector comprising mining & quarrying, manufacturing, electricity and construction is projected to decline from 7.4 per cent in 2015-16 to 5.2 per cent in 2016-17 due to fall in manufacturing and mining.
• The eight core infrastructure supportive industries, viz. coal, crude oil, natural gas, refinery products, fertilizers, steel, cement and electricity that have a total weight ofnearly 38 per cent in the IIP registered a cumulative growth of 4.9 per cent during April-November, 2016-17 as compared to 2.5 per cent during April-November, 2015-16.
• The Government has liberalized and simplified the foreign direct investment (FDI) policy in sectors like defence, railway infrastructure, construction and pharmaceuticals, etc. Sectors like services sector, construction development, computer software & hardware and telecommunications have attracted highest FDI equity inflows.
• Many new initiatives have been taken up by the Government to facilitate investment and ease of doing business in the country include such as Make-in-India, Invest India, Start Up India and e-biz Mission Mode Project under the National e-Governance Plan. Measures to facilitate ease of doing business include online application for Industrial License and Industrial Entrepreneur Memorandum through the eBiz website 24×7 for entrepreneurs; simplification of application forms for Industrial Licence and Industrial Entrepreneur Memorandum; limiting documents required for export and import to three by Directorate General of Foreign Trade; and setting up of Investor Facilitation Cell under Invest India to guide, assist and handhold investors during the entire life-cycle of the business.
Services Sector
• As per the first advance estimates of the CSO, growth rate of the services sector is projected to grow at 8.8 per cent in 2016-17. The Commercial service exports also increased and the share of India’s commercial services to global services exports increased to 3.3 per cent in 2015. Along with it tourism sector also witnessed a growth of 4.5 per cent in terms of foreign tourist arrivals (FTAs) with 8.2 million arrivals in 2015.
• As per the first advance estimates of the CSO, growth rate of the services sector is projected to grow at 8.8 per cent in 2016-17. The Commercial service exports also increased and the share of India’s commercial services to global services exports increased to 3.3 per cent in 2015. Along with it tourism sector also witnessed a growth of 4.5 per cent in terms of foreign tourist arrivals (FTAs) with 8.2 million arrivals in 2015.
Social Infrastructure, Employment and Human Development
As per the Reserve Bank of India data, expenditure on social services by Centre and States, as a proportion of GDP was 7.0 per cent during 2016-17 (BE), with education and health sectors accounting for 2.9 per cent and 1.4 per cent respectively.
As per the Reserve Bank of India data, expenditure on social services by Centre and States, as a proportion of GDP was 7.0 per cent during 2016-17 (BE), with education and health sectors accounting for 2.9 per cent and 1.4 per cent respectively.
Trends in social sector expenditure
A. Employment:
• As per the Annual Employment and Unemployment Surveys (EUS) The Labour Force Participation Rate (LFPR) at the all India level based on usual principal status approach was estimated at 50.3 per cent. The All India LFPR of females is much lower than that for males.
• The North Eastern and Southern States, in general, display high female LFPR as compared to low levels in Northern States. There is a clear shift in employment to secondary and tertiary sectors from the primary sector.
• The growth in employment by category reflects increase in both casual labour and contract workers. This has adverse implications on the level of wages, stability of employment, social security of employees owing to the ‘temporary’ nature of employment. It also indicates preference by employers away from regular/formal employment to circumvent labour laws.
• The multiplicity of labour laws and the difficulty in their compliance have been an impediment to the industrial development and employment generation.
B. Education sector:
Low learning outcomes have been a measure challenge in the schools even after improvements in access and retention as per ASER 2014. Some of the underlying causes contributing to low quality of education in the primary sector are teacher absenteeism and the shortage of professionally qualified teachers.
Biometric attendance of teachers, along with regular monitoring by local community and parents could provide solution to it. However, this should be backed by adequate teaching aids, recorded lectures, etc. to fill in for absentee teachers.
C. Health for All:
• India’s health policy aims at an integrated approach which will provide accessible, affordable and equitable quality health care to the marginalized and vulnerable sections.
• The aim of good health and well-being for all as envisaged in the Sustainable Development Goal (SDG) 3, “Ensure healthy lives and promote well-being for all at all ages” should be synchronized with India’s domestic targets to reap the benefits of the ‘demographic dividend.
• Achievements in health sector include
a. Life expectancy has doubled and infant mortality and crude death rates have reduced sharply.
b. India’s total fertility rate (TFR) has been steadily declining and was 2.3 (rural 2.5 & urban 1.8) during 2014.
c. Infant Mortality Rate (IMR) has declined to 37 per 1000 live births in 2015 from 44 in 2011. The challenge lies in addressing the huge gap between IMR in rural (41 per 1000 live births) and urban (25 per 1000 live births) areas.
d. The Maternal Mortality Ratio (MMR) declined from 301 maternal deaths per 100,000 live births during 2001-03 to 167 maternal deaths per 100,000 live births during 2011-13. There are wide regional disparities in MMR, with States like Assam, Uttar Pradesh, Rajasthan, Odisha, Madhya Pradesh and Bihar recording MMR well above the all India MMR of 167.
e. The high levels of anaemia prevalent among women in the age group 15-49 have a direct correlation with high levels of MMR. In Haryana and West Bengal more than 60 per cent of women suffer from anaemia. Under the National Health Mission, Government of India has programmes to address the issue of anaemia through health and nutrition education to promote dietary diversification, inclusion of iron foliate rich food as well as food items that promote iron absorption.
Inclusive Policies of the Government
• To have an inclusive society and equal opportunities government has initiated a number of programmes. These include Accessible India Campaign, schemes meant for the economic and social empowerment of people belonging to the minority communities. For social empowerment, the ‘Nai roshni’ scheme for leadership development of minority women, ‘PadhoPradesh’, a scheme of interest subsidy on educational loans for overseas studies for the students belonging to the minority communities, etc. are being implemented.
• For skill development and economic empowerment of minorities, schemes like ‘Seekho Aur Kamao’ (Learn & Earn), Upgrading Skill and Training in Traditional Arts/Crafts for Development (USTTAD) and ‘Nai Manzil’- a scheme to provide education and skill training to the youth from minority communities are in operation.
Climate Change
To combat climate change and unleash actions and investment towards a low carbon, resilient and sustainable future The Paris Agreement entered into force on 4th November 2016.
At 22nd Session of the Conference of Parties (COP 22) to UNFCCC held in Marrakech, Morocco major thrust areas were developing rules and action framework for operationalizing the Paris Agreement and advance work on pre-2020 Actions, Marrakech Action Proclamation for our Climate and Sustainable Development” which captured the sense of urgency to take action on climate change, need to strengthen and support efforts to eradicate poverty, ensure food security and enhance resilience of agriculture and mobilization of USD 100 billion per year as green fund.
India’s green actions:
• India ratified the Paris Agreement.
• India’s comprehensive NDC target is to lower the emissions intensity of GDP by 33 to 35 per cent by 2030 from 2005 levels, to increase the share of non-fossil fuels based power generation capacity to 40 per cent of installed electric power capacity by 2030, and to create an additional (cumulative) carbon sink of 2.5-3 GtCO2e through additional forest and tree cover by 2030.
• A target of 175 GW of renewable energy capacity to be reached by 2022 In order to achieve the target, the major programmes/ schemes on implementation of Solar Park, Solar Defence Scheme, Solar scheme for Central Public Sector Undertakings, Solar photovoltaic (SPV) power plants on Canal Bank and Canal Tops, Solar Pump, Solar Rooftop, etc. have been launched in recent years.
• India attained 4th position in global wind power installed capacity after China, USA and Germany.
• As on 31st October 2016, India achieved 46.3 GW grid-interactive power capacity; 7.5 GW of grid-connected power generation capacity in renewable energy; and small hydro power capacity of 4.3 GW. In addition, 92305 Solar Pumps were installed and Rs.38,000 crore worth of Green Energy Corridor is being set up to ensure evacuation of renewable energy.
• National Tariff Policy for electricity was amended focus on the environmental aspect with provisions such as
1. Renewable Purchase Obligation in which 8 per cent of electricity consumption excluding hydro power shall come from solar energy by March 2022;
2. Renewable Generation Obligation in which new coal/lignite based thermal plants after specified date to also establish/procure/ purchase renewable capacity;
3. Bundling of renewable power with power from plants whose Power Purchase Agreements have expired or completed their useful life;
4. No inter-state transmission charges for solar and wind power;
5. Procurement of 100 per cent power produced from waste-to energy plants;
6. Ancillary services to support grid operation for expansion of renewable energy, etc.
Apart from it Launch of Solar Alliance, establishment the National Adaptation Fund for Climate Change to assist States and Union Territories to undertake projects and actions for adaptation to climate change, imposition of Clean Environment Cess to finance projects under Green Energy Corridor for boosting up the transmission sector, Namami Gange, Green India Mission, Jawaharlal Nehru National Solar Mission, installation of SPV lights and small capacity lights, installation of SPV water pumping systems, SPV Power Plants and Grid Connected Rooftop SPV Power Plants are some major initiatives to fight climate change.
Supplementary Reading
A. Concept of Inclusive Growth
Inclusive growth basically means, “Broad based growth, shared growth, and pro-poor growth”. Rapid and sustained poverty reduction requires inclusive growth that allows people to contribute to and benefit from economic growth. Rapid pace of growth is unquestionably necessary for substantial poverty reduction, but for this growth to be sustainable in the long run, it should be broad-based across sectors, and inclusive of the large part of the country’s labor force. This definition of inclusive growth implies a direct link between the macro and micro determinants of growth. The micro dimension captures the importance of structural transformation for economic diversification and competition, including creative destruction of jobs and firms.
Inclusive growth basically means, “Broad based growth, shared growth, and pro-poor growth”. Rapid and sustained poverty reduction requires inclusive growth that allows people to contribute to and benefit from economic growth. Rapid pace of growth is unquestionably necessary for substantial poverty reduction, but for this growth to be sustainable in the long run, it should be broad-based across sectors, and inclusive of the large part of the country’s labor force. This definition of inclusive growth implies a direct link between the macro and micro determinants of growth. The micro dimension captures the importance of structural transformation for economic diversification and competition, including creative destruction of jobs and firms.
Processes of inclusion
The three distinct processes of inclusion are: (i) social inclusion, (ii) economic inclusion, and (iii) political inclusion.
The three distinct processes of inclusion are: (i) social inclusion, (ii) economic inclusion, and (iii) political inclusion.
i) Social Inclusion
Social inclusion is an overarching framework for addressing various social policy issues, including income inequality, skill levels, education, health inequalities, housing affordability, and work-life balance. Social inclusion promotes more active participation of people living in communities.
Social inclusion is an overarching framework for addressing various social policy issues, including income inequality, skill levels, education, health inequalities, housing affordability, and work-life balance. Social inclusion promotes more active participation of people living in communities.
ii) Economic Inclusion
The relationship between a productive economy and a society that enjoys high levels of participation, connection and cohesion, and their combined impact on peoples’ wellbeing is well appreciated by scholars in recent times. It is their view that an inclusive economy improves the wellbeing of people by directing policy to ensure that there are broad based opportunities to participate in society and the economy.
The relationship between a productive economy and a society that enjoys high levels of participation, connection and cohesion, and their combined impact on peoples’ wellbeing is well appreciated by scholars in recent times. It is their view that an inclusive economy improves the wellbeing of people by directing policy to ensure that there are broad based opportunities to participate in society and the economy.
iii) Political Inclusion
Inclusiveness in the political sphere is vital for social development. A democratic and participatory political organization empowers people to raise their voices against injustices and deprivation. The political inclusion has two main avenues of inclusion: quotas and caste base in political parties.
Inclusiveness in the political sphere is vital for social development. A democratic and participatory political organization empowers people to raise their voices against injustices and deprivation. The political inclusion has two main avenues of inclusion: quotas and caste base in political parties.
B. Paris agreement
• The 21st Conference of Parties (COP 21) under the United Nations Framework Convention on Climate Change (UNFCCC) successfully concluded in Paris after intense negotiations by the Parties followed by the adoption of the Paris Agreement on post-2020 actions on climate change. This universal agreement will succeed the Kyoto Protocol.
• Unlike the Kyoto Protocol, it provides a framework for all countries to take action against climate change.
• Placing emphasis on concepts like climate justice and sustainable lifestyles, the Paris Agreement for the first time brings together all nations for a common cause under the UNFCCC.
• One of the main focus of the agreement is to hold the increase in the global average temperature to well below 2°C above pre- industrial level and on driving efforts to limit it even further to 1.5°C.
• It covers all the crucial areas identified as essential for a comprehensive and balanced agreement, including mitigation, adaptation, loss and damage, finance, technology development and transfer, capacity building and transparency of action and support.
• Salient features of the Paris Agreement:
a) The Paris Agreement acknowledges the development imperatives of developing countries by recognizing their right to development and their efforts to harmonize it with the environment, while protecting the interests of the most vulnerable.
b) The Agreement seeks to enhance the ‘implementation of the Convention’ while reflecting the principles of equity and CBDR-RC, in the light of different national circumstances.
c) Countries are required to communicate to the UNFCCC climate action plans known as nationally determined contributions (NDCs) every five years. Each Party’s successive NDC will represent a progression beyond the Party’s then current NDC thereby steadily increasing global effort and ambition in the long term.
d) The Agreement is not mitigation-centric and includes other important elements such as adaptation, loss and damage, finance, technology development and transfer, capacity building and transparency of action and support.
e) Climate action will also be taken forward in the period before 2020. Developed countries are urged to scale up their level of financial support with a complete road map towards achieving the goal of jointly providing US$ 100 billion by 2020. At the same time, a new collective quantified goal based on US$ 100 billion floor will be set before 2025.
f) The Agreement mandates that developed countries provide financial resources to developing countries. Other Parties may also contribute, but on a purely voluntary basis.
g) Developed countries are urged to take the lead in mobilization of climate finance, while noting the significant role of public funds in the mobilization of finance which should represent a progression beyond their previous effort.
h) The Agreement includes a robust transparency framework for both action and support.
i) Starting in 2023, a global stock take covering all elements will take place every five years to assess the collective progress towards achieving the purpose of the Paris Agreement and its long term goals.
j) The Paris Agreement establishes a compliance mechanism, overseen by a committee of experts that operates in a non-punitive way, and is facilitative in nature.
• A marked departure from the past is the Agreement’s bottom-up approach, allowing each nation to submit its own national plan for reducing greenhouse gas emissions, rather than trying to repeat a top-down approach advocated by the Kyoto Protocol, giving each country an emission reduction target.
Masala Bonds
Masala Bonds
‘Masala Bonds’ are Indian rupee denominated bonds issued in offshore capital markets which issued to offshore investors settled in dollars and, therefore, the currency risk resides with investors. It is used to refer to rupee-denominated borrowings by Indian entities in overseas markets.
The International Finance Corporation (IFC) the investment branch of the World Bank issued a 10-year, 10 billion Indian rupee bonds in November 2014 to increase foreign investment in India and mobilize international capital markets to support infrastructure development in the country.
Masala bond was the first Indian bond to get listed in London Stock Exchange. IFC named it Masala bonds to give a local flavour by calling to mind Indian culture and cuisine. Moreover, there are popular bonds name are there in the list Dim-Sum Bond of China and Samurai Bonds of Japan, Yankee of USA and the bulldog of UK.
What are the benefits of issuing of the Masala Bonds?
• It assists the Indian companies to diversify their bond portfolio. Now Indian companies can issue Masala Bonds in addition to the corporate bonds. It helps the Indian companies to cut down cost. If the company issues any bond in India, it carries an interest rate of 7.5%-9.00% whereas; Masala Bonds outside India is issued below 7.00% interest rate.
• It will helps in building up foreign investors confidence in Indian economy and currency which will strengthen the foreign investment in the country. It helps companies to tap a large number of investors as these bonds are issued in the offshore market.
• Offshore investor earns better returns by investing in Masala Bonds rather than by investing in his home country. An investor will benefit from his investment in Masala Bond if the rupee appreciates at the time of maturity.
• The Finance Ministry has cut the withholding tax (a tax deducted at source on residents outside the country) on interest income of such bonds to 5% from 20%, making it attractive for investors. Also, capital gains from rupee appreciation are exempted from tax.
• India is that rare fast-growing large economy, and ‘Masala Bonds’ are one way for investors to take advantage of this.
• These measures are intended to further deepen market development, enhance participation, facilitate greater market liquidity and improve communication. It results to widen the investor pool and ultimately deepen the market for additional Tier 1 and Tier 2 bond issuance amounts to ease a key constraint for banks in accessing new AT 1 and T 2 capital, given the limited size of the domestic investor pool relative to the scale of the capital need.
• It allows Indian companies, banks, non-banking finance companies (HDFC, India Bulls Housing Finance are examples of such companies) and infrastructure investment trusts and real investment trusts (investment vehicles that pool money from various investors and invest in infrastructure and real estate sectors) to issue rupee-denominated bond overseas.
Municipal Bonds
Municipal Bonds
A municipal bond is a debt obligation issued by a local authority with the promise to pay the bond interest on a speci?ed payment schedule and the principal at maturity.
They can be either general obligation bonds, where the principal and interest are guaranteed by the issuer’s overall tax revenues or they can be revenue bonds, where the principal and interest are secured by revenues from a particular project of the ULBs. It could be derived from tolls, charges or rents from the facility built with the proceeds of the bond issue.
The two basic types of municipal bonds are:
• General obligation bonds: Principal and interest are secured by full faith and credit of the issuer and usually guaranteed by either the issuer’s unlimited or limited tax paying power.
• Revenue bonds: Principal and interest are secured by revenues of ULBs derived from tolls, charges or rents from the facility built with the proceeds of the bond issue. Public projects financed by revenue bonds include toll roads, bridges, airports, water and sewage treatment facilities, hospitals and subsidised housing.
• Revenue bonds: Principal and interest are secured by revenues of ULBs derived from tolls, charges or rents from the facility built with the proceeds of the bond issue. Public projects financed by revenue bonds include toll roads, bridges, airports, water and sewage treatment facilities, hospitals and subsidised housing.
The market for municipal bonds in India is almost non-existent unlike US and many developing countries like Russia, Mexico, where it is one of the principal mode of financing urban infrastructure.
The Government of India allowed ULBs to issue tax-free municipal bonds in 1999-2000 and has amended the Income Tax Act (1961 vide the Finance Act 2000) inserting a new clause (vii) in Section 10(15), whereby interest income from bonds issued by local authorities was exempted from income tax.
The GOI issued guidelines for issue of tax-free municipal bonds in February 2001. It has been clearly specified that the funds raised from these tax-free municipal bonds are to be used only for capital investments in urban infrastructure like potable water supply, sewerage or sanitation, drainage, solid waste management, roads, bridges and flyovers; and urban transport.
Ahmedabad Municipal Corporation (AMC) was the first ULBs in India to issue tax-free municipal bonds for water and sewerage projects. In April 2002, AMC issued a tax-free 10-year bonds worth Rs 1000 crore followed by Tamil Nadu Urban Development Fund (TNUDF) in 2003 which issued a bond by pooling 14 municipalities for commercially viable water and sewerage infrastructure projects. Subsequently, the Government of Karnataka used the concept of pooled financing to raise debt from investors for the Greater Bangalore Water Supply and Sewerage Project (GBWASP).
On July 2015, SEBI notified a new regulatory framework for issuing municipal bonds in India for streamlining the system of the municipal bond market in India.
Some main features include
• Investment grade ratings for ULBs,
• No default in last 365 days and positive net worth,
• A mandated guarantee from the State Government or Central Government,
• Compliance with the state’s municipal account standards or the National Municipal Accounts Manual to be eligible for the issue, etc.
• No default in last 365 days and positive net worth,
• A mandated guarantee from the State Government or Central Government,
• Compliance with the state’s municipal account standards or the National Municipal Accounts Manual to be eligible for the issue, etc.
Market Stabilization Bonds
Market Stabilization Bonds
MSS (Market Stabilisation Scheme) securities are issued with the objective of providing the RBI with a stock of securities with which it can intervene in the market for managing liquidity.
The Reserve Bank under Governor YV Reddy initiated the MSS scheme in 2004.
These securities are issued not to meet the government’s expenditure.
These are special bonds floated on behalf of the government by the RBI for the specific purpose of mop ping up the excess liquidity in the system when regular government bonds prove inadequate.
These are special bonds floated on behalf of the government by the RBI for the specific purpose of mop ping up the excess liquidity in the system when regular government bonds prove inadequate.
These are mostly shorter-tenure bonds, of less than six months maturity. But the tenure differs depending on the requirement.
The bonds issued under MSS have all the attributes of the existing treasury bills and dated securities.
These securities will be issued by way of auctions to be conducted by the RBI.
The timing of issuance, amount and tenure of such securities will be decided by the RBI.
The money obtained under MSS should be kept with the RBI in a separate account called MSS Account. It should not be transferred to the government. This is because, if it is transferred, government will spend the money in the economy thereby adding to liquidity.
Interest payments have to be given to the institutions who buys bond. Here, for the interest payment, the government allocates money from its budget to the RBI. This expenditure to service interest payment for MSBs is called carrying cost.

No comments:
Post a Comment