
Generation of Economic Reforms
Generation of Economic Reforms
Generation of Economic Reforms
• The reform process in India was initiated with the aim of accelerating the pace of economic growth and eradication of poverty. The process of economic liberalization in India can be traced back to the late 1970s. However, the reform process began in earnest only in July 1991.

• With the onset of the reforms the Government signaled a systemic shift to a more open economy with greater reliance upon market forces, a larger role for the private sector including foreign investment, and a restructuring of the role of Government. The reforms of the last two and a half decades have gone a long way in freeing the domestic economy from the control regime.
• An important feature of India’s reform programme is that it has emphasized gradualism and evolutionary transition rather than rapid restructuring or “shock therapy”.
First Generation Reforms (1991 onwards)
• It had its origin in 1985 when the New Economic Policy declared emphasised on improvement in productivity, absorption of modern technology and fuller utilisation of capacity and finally on the greater role for the private sector.
• The economic reforms initiated in 1991 introduced far-reaching measures, which changed the working and machinery of the economy. The reforms have unlocked India’s enormous growth potential and unleashed powerful entrepreneurial forces.
• Since 1991, successive governments have successfully carried forward the country’s economic reform agenda in response to the changes in the nature of markets and institutions, industrial organisation and structures and social relations of production.
• These changes were pertinent to the following:
– Dominance of the public sector in the industrial activity
– Discretionary controls on industrial investment and capacity expansion
– Trade and exchange controls
– Limited access to foreign investment
– Public ownership and regulation of the financial sector
• The focus of reforms was mostly on stabilization with a little stress on structural reforms.
– Discretionary controls on industrial investment and capacity expansion
– Trade and exchange controls
– Limited access to foreign investment
– Public ownership and regulation of the financial sector
• The focus of reforms was mostly on stabilization with a little stress on structural reforms.
• New policy introduced various changes regarding industrial licensing, technology up-gradation, elimination of controls and restrictions, foreign capital, fiscal policy, rationalizing and simplifying the system of fiscal and administrative regulation and export-import policy in order to provide greater scope to private sector.
• The policy changes were expected to provide a big boost in private sector investment particularly in the corporate segment of manufacturing industry which would, in turn usher in rapid growth of the economy as well as pave the way for modernization of the economy.
• Broader Reforms among First Generation were as follows:
– Chelliah Committee suggestions in Taxation, focus was on broadening the Tax Base.
– Narasimham Committee suggestions for Financial Sector, focus was on increasing stability.
– LPG reforms through New Industrial Policy, focus was on freeing the economy from clutches of ageing public sector.
– Partial convertibility of Rupee in Current Account.
– Narasimham Committee suggestions for Financial Sector, focus was on increasing stability.
– LPG reforms through New Industrial Policy, focus was on freeing the economy from clutches of ageing public sector.
– Partial convertibility of Rupee in Current Account.
Second Generation Reforms
• In a way the Second Generation Reforms began in right earnest in 1999. India embarked on an exercise of cutting personal taxes, investing in infrastructure and creating world class companies.
• Second generation of economic reforms in the country gave special stress on fiscal reforms, financial reforms, structural reforms, labour law reforms etc. Major fiscal reforms have been undertaken for broadening the income tax base and streamlining the excise and customs duty structures.
• Major financial sector reforms undertaken by the government include allowing private companies to enter into insurance sector, allowing foreign bank to open their branches in India.
• The focus of reforms was on structural reforms through institutional strengthening. Overall, the objective was to push economy on a higher growth trajectory & the second generation reforms did pushed India to 8% growth path as against 6% growth path that was guided by first generation reforms.
• Broader Reforms among Second Generation were as follows –
– Foreign Exchange – Abolition of (FERA) Foreign Exchange Regulation Act and creation of (FEMA) Foreign Exchange Management Act; Partial convertibility of Rupee in Capital Account on basis of Second Tarapore Committee
– Labour – Voluntary Retirement Scheme (VRS); Board for Industrial and Financial Reconstruction (BIFR); National Renewal Fund
– Financial Sector – Narasimham Committee II suggestions regarding prudential norms and the Capital Adequacy Ratio (CAR)
– Taxation – Value Added Tax (VAT); Kelkar Panel Suggestions on Direct tax; Provision of Minimum Alternate Tax (MAT), Fringe Benefit Tax (FBT) and other tax avoidance aspects; Introduction of service tax
Third Generation Reforms
• Currently India is under 3rd generation of reforms.
• The First & Second generation of reforms had a few downsides. The GDP had been growing but the GDP per capita still left a lot to be desired. India ranks much lower than Asian and Latin American peers when compared on parameters like GDP per capita and Tax/GDP. This is one of the first challenges before the Indian government.
• The second challenge was the creation of world class infrastructure. We are not only referring to infrastructure in terms of roads, railways and ports; but also in terms of manufacturing and manpower infrastructure.
• The third area of focus is on creating, encouraging and nurturing the spirit of entrepreneurship.
• Broader Reforms among Third Generation were as follows:
– GST (Goods and Service Tax)
– Exit Policy/ Bankruptcy Code
– Capital easing norms for start-ups or entrepreneurs through Mudra Bank
– Exit Policy/ Bankruptcy Code
– Capital easing norms for start-ups or entrepreneurs through Mudra Bank
Economic Survey Chapter – 10
Income, Health, and Fertility: Convergence Puzzles
Income, Health, and Fertility: Convergence Puzzles-Economic Survey Chapter – 10
Context
Despite rapid overall growth, there is striking evidence of divergence, or widening gaps in income and consumption across the Indian states, in sharp contrast to patterns within China and across the world. This trend is particularly puzzling since that the forces of equalization-trade in goods and movement of people-are stronger within India than they are across countries, and they are getting stronger over time. Compared to international standards and accounting for levels of income, India does well on life expectancy, not-so-well on infant mortality rate, and strikingly well on fertility rate.
Hence in this Chapter there is analysis of India’s growth and development in the parameters of Income, Health, and Fertility. Also it presents how all these parameters show convergence as well as divergence compared to other countries of the world. Especially it focuses on China and India in many instances.
Technical Terms
A. Gross State Domestic Product (GSDP) is defined as a measure, in monetary terms, of the volume of all goods and services produced within the boundaries of the State during a given period of time, accounted without duplication.
B. Life expectancy at birth (LE) indicates the number of years a newborn would live if prevailing patterns of mortality at the time of its birth were to stay the same throughout its life.
C. Infant mortality rate (IMR) is defined as the number of infants dying before reaching one year of age, per 1,000 live births in a given year.
D. Total fertility rate (TFR) is defined as the number of children that would be born to a woman if she were to live to the end of her childbearing years and bear children in accordance with age-specific fertility rates in a given year.
E. Convergence means that a state that starts off at low performance levels on an outcome of importance, say the level of income or consumption, should see faster growth on that outcome over time, improving its performance so that it catches up with states which had better starting points.
Gist of Economic Survey Chapter
Despite rapid overall growth, there is striking evidence of divergence, or widening gapsin income and consumption across the Indian states, in sharp contrast to patterns within China and across the world. This trend is particularly puzzling since that the forces of equalization-trade in goods and movement of people-are stronger within India than they are across countries, and they are getting stronger over time. This raises the possibility that governance traps are impeding equalization within India. In contrast,health outcomes are converging within India. Compared to international standards and accounting for levels of income, India does well on life expectancy, not-so-well on infant mortality rate, and strikingly well on fertility rate.
India’s economic performance has been remarkable in the aggregate. Its continued success as a federation depends on the progress of each of its individual states. What can be a reasonable standard for assessing how well the states are doing? One intuitive metric can be to see how well individual states have done over time on two broad sets of indicators: economic and health/demographic indicators. This analysis starts from the 1980s because it allows for a longer term perspective; but also because that is the time when the structural break from the previous era of the “Hindu Growth Rate”(to use the late Professor Raj Krishna’s term).
India’s economic performance has been remarkable in the aggregate. Its continued success as a federation depends on the progress of each of its individual states. What can be a reasonable standard for assessing how well the states are doing? One intuitive metric can be to see how well individual states have done over time on two broad sets of indicators: economic and health/demographic indicators. This analysis starts from the 1980s because it allows for a longer term perspective; but also because that is the time when the structural break from the previous era of the “Hindu Growth Rate”(to use the late Professor Raj Krishna’s term).
Income Levels over the years in India, All Indian States
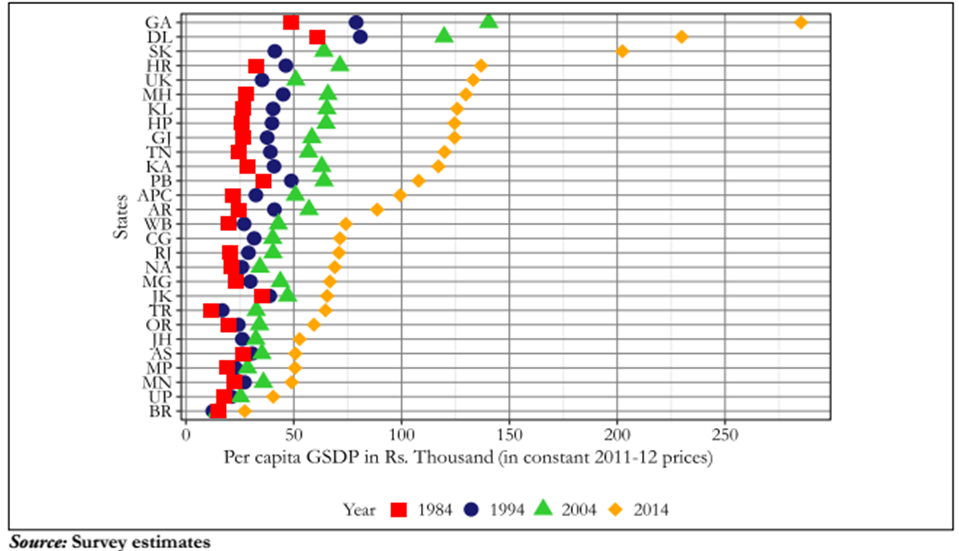
Plots the level of real per capita GSDP over time between 1983 and 2014(the latest year for which comprehensive datais available). It is clear that, especially during the last decade, there has been an across-the board improvement reflected in the whole distribution shifting right. For example,between 1984 and 2014, the least developed state (Tripura) increased its per capita GSDP5.6 fold; (from per capita GSDP of Rs.11,537 in 1984 to Rs. 64,712 in 2014) and the median state (Himachal Pradesh) increased its income level 4.3 fold.
Life Expectancy Levels Over Time in India
Infant Mortality Rate (IMR) Levels Over Time in India
Total Fertility Rate (TFR) Levels Over Time in India
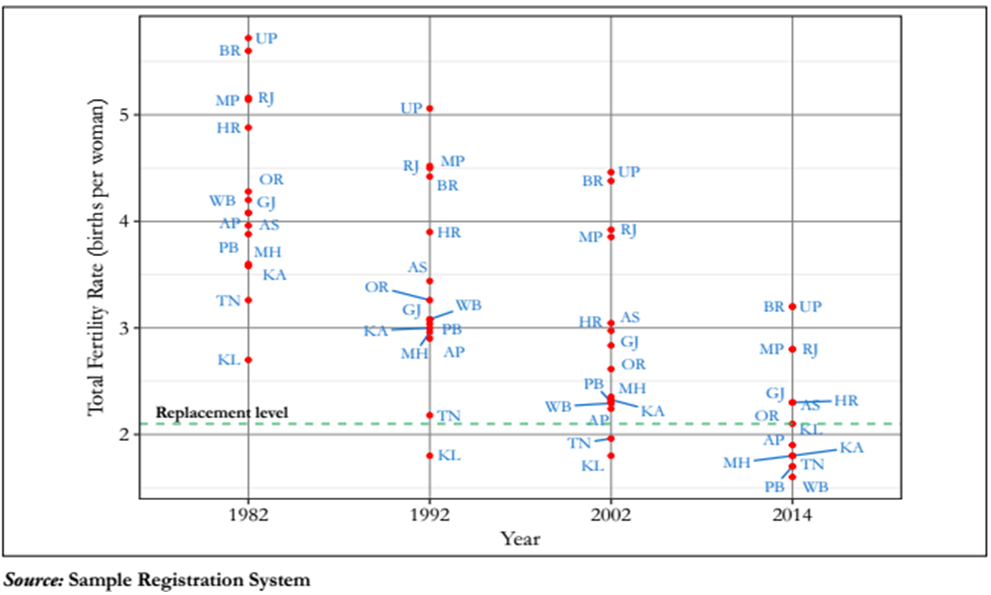
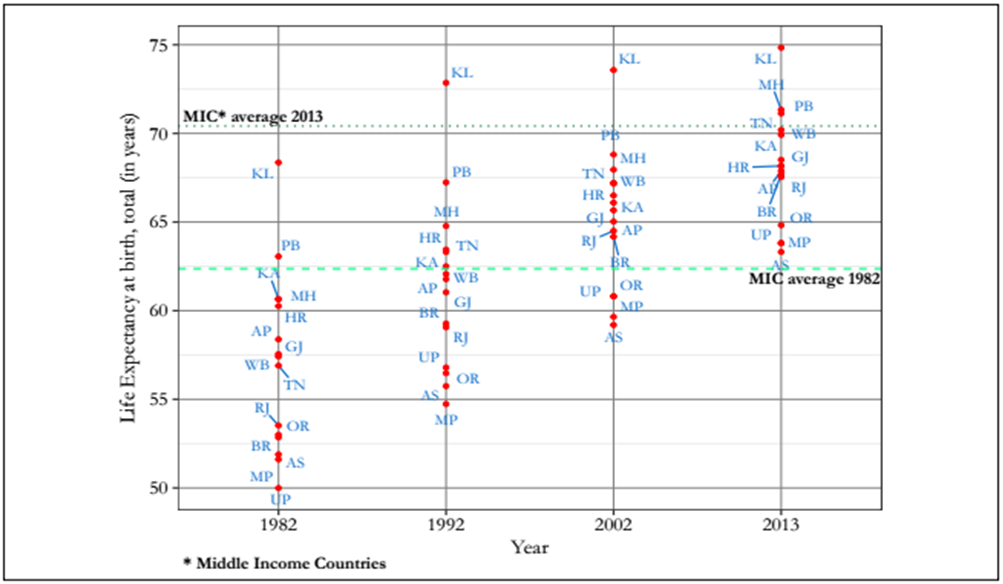
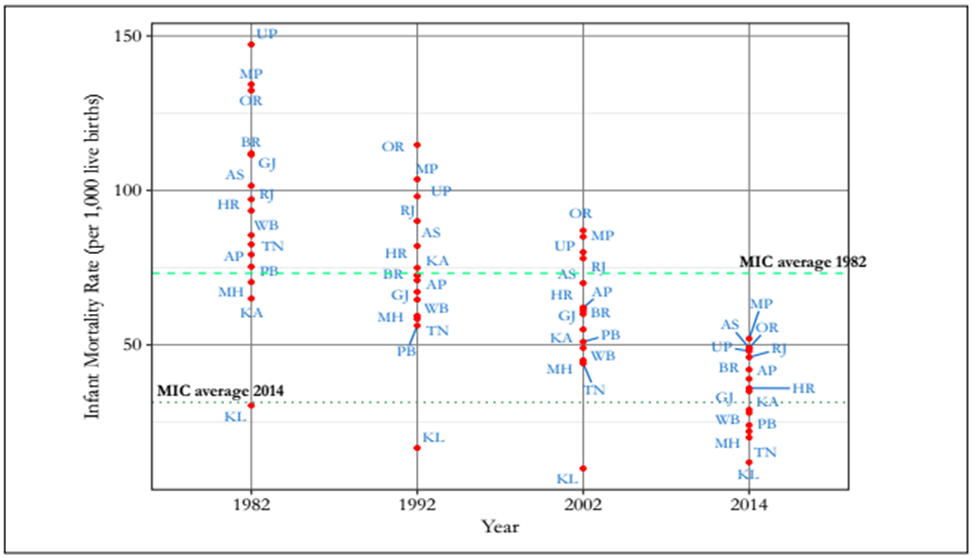
Figures 2A, 2B and 2C show plotsfor life expectancy, infant mortality rate,and total fertility rate for Indian states. Life Expectancy at birth (LE) indicates the numberof years a new-born would live if prevailingpatterns of mortality at the time of its birthwere to stay the same throughout its life.
IInfant mortality rate (IMR) is defined as the number of infants dying before reaching one year of age, per 1,000 live births in a given year. Total fertility rate (TFR) is defined as the number of children that would be born to a woman if she were to live to the end of her child bearing years and bear children in accordance with age-specific fertility rates in a given year.
Across these health and demographic indicators, there have been dramatic improvements: Over the last 3 decades, the poorest performer (UP) has increased its life expectancy by 13.8 years, reduced its IMRby 99 points, and lowered its TFR by 2.5 points (with a level of 3.2 TFR in 2014).
The corresponding numbers for the median state are: A rise in life expectancy by 12.5 years (West Bengal), a fall in IMR by 36 points (Karnataka), and a drop in TFR by 1.8 points (Assam).
While these developments are encouraging, they don’t allow a full assessment because there is no obvious benchmark to measure these improvements. How has Odisha done relative to Kerala? How haveOdisha and Kerala done relative to otherstates? Economic theory provides one metricto make such comparisons: convergence (orunconditional convergence).
Convergence means that a state thatstarts off at low performance levels on an outcome of importance; say the level of income or consumption, should see faster growth on that outcome over time, improving its performance so that it catches up with states which had better starting points. For example, since the per capita GSDP of Odisha in 1984 was 25 percent lower than the per capita GSDP of Kerala, traditional convergence theory would suggest that Odisha would experience higher growth rates over time, thereby reducing the gap between the two states.
Convergence is thus an intuitive measureof absolute and relative performance, allowing national and international comparisons. It measures the rate of catch-up, in particular whether less developed states have caught up with richer ones and hence whether regional dispersion is increasing.
The relationship is strongly negative for the world and China, and weakly positive for India.Poorer countries are catching up with richer countries, the poorer Chinese provinces are catching up with the richer ones, but in India,the less developed states are not catching up; instead they are, on average, falling behind the richer states.
Internationally, growth rates of per capita GDP widened at least since the 1820s with poorer countries growing slower than richer countries, leading to the basic divide between advanced and developing countries. However, since 1980 this long term trend was reversed and poorer countries started catching up with richer ones. In stark contrast, there continues to be divergence within India or an aggravation of regional inequality.
The opposing results in India versus those in China and internationally poses a deep puzzle. Convergence happens essentially through trade and through mobility of factors of production. If a state/country is poor, the returns to capital must be high and should be able to attract capital and labour,thereby raising its productivity and enabling catch up with richer states/countries. Trade,based on comparative advantage, is really a surrogate for the movement of underlying factors of production as Samuelson pointed out early on. A less developed country that has abundant labour and scarce capital will export labour-intensive goods (a surrogate for exporting unskilled labour) and imports capital-intensive goods (a surrogate for attracting capital).
The main finding suggests that India stands out as an exception.Within India, where borders are porous,convergence has failed whereas in China,we observe successful convergence. Even across countries where borders are much thicker (because of restrictions on trade, capital and labour) the convergence dynamic has occurred. The driving force behind the Chinese convergence dynamic has been the migration of people from farms in the interior to factories on the coast, raising productivity and wages in the poorer regions faster than in richer regions.
The Indian puzzle is deeper still because it can be seen that, contrary to perception, trade within India is quite high. Although further research is requiredto understand the underlying reasons, one possible hypothesis is that convergence failsto occur due to governance or institutional traps. If that is the case, capital will not ûow to regions of high productivity because this high productivity may be more notional than real. Poor governance could make the risk-adjusted returns on capital low even in capital scarce states. Moreover, greater labour mobility or exodus from these areas, especially of the higher skilled, could worsen governance.
A second hypothesis relates to India’s pattern of development. India,unlike most growth successes in Asia, has relied on growth of skill-intensive sectors rather than low-skill ones (reûected not just in the dominance of services over manufacturing but also in the patterns of specialization within manufacturing). Thus,if the binding constraint on growth is the availability of skills, there is no reason why labour productivity would necessarily be high in capital scarce states. Unless the less developed regions are able to generate skills, (in addition to providing good governance) convergence may not occur.
Both these hypotheses are ultimately not satisfying because they only raise an even deeper political economy puzzle. Given the dynamic of competition between states where successful states serve both as models (examples that become evident widely) and magnets (attracting capital, talent, and people),why isn’t there pressure on the less developed states to reform their governance in ways that would be competitively attractive? Inother words, persistent divergence amongst the states runs up against the dynamic of competitive federalism which impels, or atleast should impel, convergence.
In contrast, on health and demography,there is strong evidence of convergence amongst the states in the 2000s. This was not true in the previous decades for IMR and fertility. Here it is the international contrast is striking. With regards to life expectancy, the Indian states are close to where they should be given their level of income. However, this is not true of IMR,suggesting that the “mother and child” bear the brunt of weaker delivery of health services.What really stand out in the international comparison are fertility and how much better the Indian states are performing than their international counterparts on that metric.These unusually large declines in fertility have strong—and positive—implications for India’s demographic dividend going forward.
Supplementary Readings
A. Indian States By GDP Per Capita
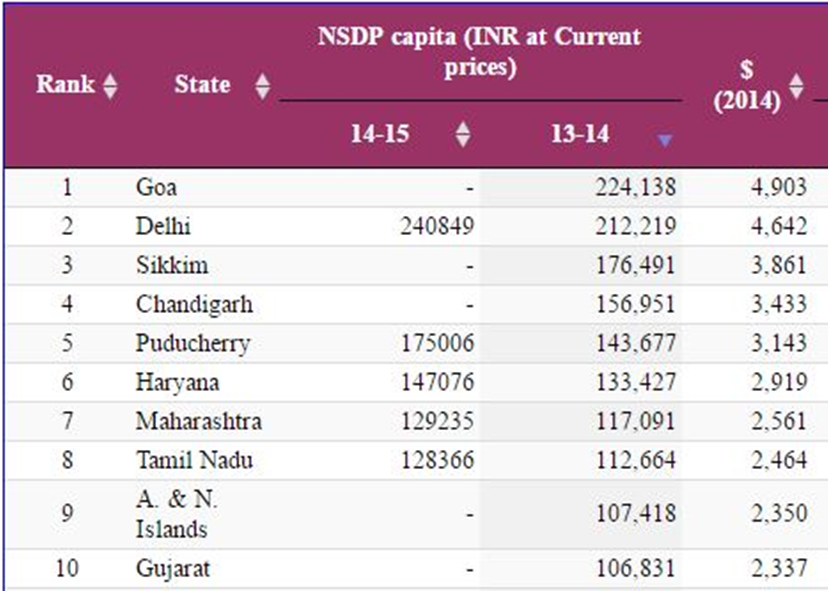
Goa has highest NSDP per capita among 33 Indian states and union territories. NSDP per capita of Goa is estimated at 224,138 Indian rupees in 2013-14 at current prices. Ranking of Delhi is two with per capita income around of 212,219 INR. Sikkim is at third, Chandigarh is at forth and Puducherry is fifth richest economy of India.
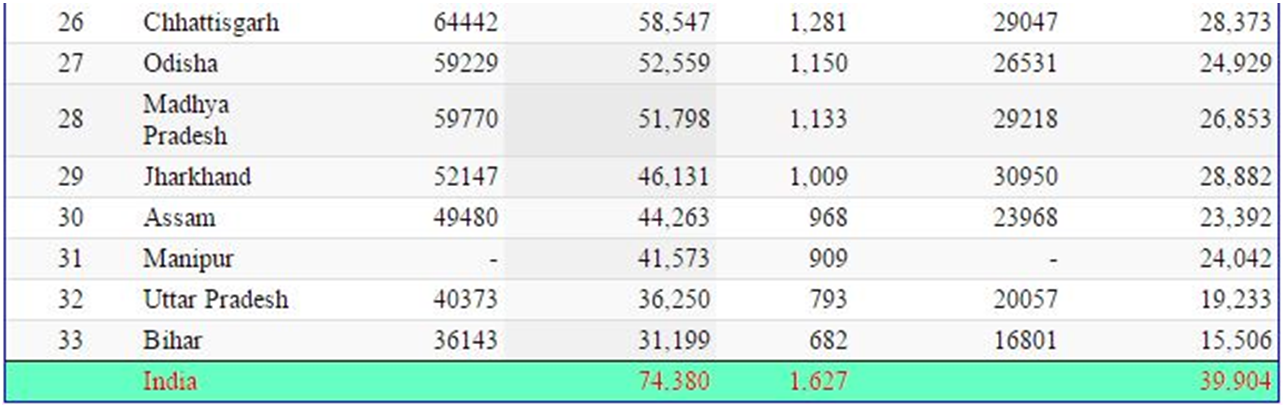
Bihar, Uttar Pradesh, Manipur, Assam, and Jharkhand is top 5 poorest state in terms of nsdp per capita. These five states have net state domestic product per capita below Rs. 50,000.
Per capita income of Goa is 3.01 times more than India’s average and 7.18 times more than poorest state Bihar. GDP per capita of Bihar is 31,199 INR for year 2013-14 and 36,143 for 2014-15.
Goa has highest NSDP per capita among 33 Indian states and union territories. NSDP per capita of Goa is estimated at 224,138 Indian rupees in 2013-14 at current prices. Ranking of Delhi is two with per capita income around of 212,219 INR. Sikkim is at third, Chandigarh is at forth and Puducherry is fifth richest economy of India.
Bihar, Uttar Pradesh, Manipur, Assam, and Jharkhand is top 5 poorest state in terms of nsdp per capita. These five states have net state domestic product per capita below Rs. 50,000.
Per capita income of Goa is 3.01 times more than India’s average and 7.18 times more than poorest state Bihar. GDP per capita of Bihar is 31,199 INR for year 2013-14 and 36,143 for 2014-15.
B. Per Capita Income For States
Top Ranked States (Decreasing Order)
Top Ranked States (Decreasing Order)
Least Ranked States (Decreasing Order)
C. India and the MDGs Related to IMR, MMR
Goal 4: Reduce Child Mortality
The fourth Millennium Development Goal aims to reduce mortality among children under five by two-thirds. India’s Under Five Mortality (U5MR) declined from 125 per 1,000 live births in 1990 to 49 per 1,000 live births in 2013. The MDG target is of 42 per 1000, which suggests that India is moderately on track, largely due to the sharp decline in recent years.
Children Matter
• More than one third of the population is below 18 years. We have the largest young population in the world. This is not a “demographic dividend” if millions of young people lack access to health and education and are prevented from becoming useful members of society. It can become a “demographic trap” if each new generation fails to space and limit family size.
• 38% births are not registered which impacts adversely on planning as well as nationality.
• Two thirds of deaths occur in the first week of life and two thirds of them in the 2 days of life. Almost 45% of neonatal deaths take place within 48 hours of birth.
• The declining number of girls in the 0-6 age group is a cause for alarm. For every 1000 boys there are only 927 females – even 798 in Punjab & 819 in Haryana.
Goal 5: Improve Maternal Health
From a Maternal Mortality Rate (MMR) of 437 per 100,000 live births in 1990-91, India is required to reduce MMR to 109 per 100,000 live births by 2015. Between 1990 and 2006, there has been some improvement in the Maternal Mortality Rate (MMR), which has declined to 167 per 100,000 live births in 2009. However, despite this, India’s progress on this goal has been slow and off track.
From a Maternal Mortality Rate (MMR) of 437 per 100,000 live births in 1990-91, India is required to reduce MMR to 109 per 100,000 live births by 2015. Between 1990 and 2006, there has been some improvement in the Maternal Mortality Rate (MMR), which has declined to 167 per 100,000 live births in 2009. However, despite this, India’s progress on this goal has been slow and off track.
Causes of High Maternal Mortality
• Around 30% of all women need emergency care during delivery.
• Only 35% of all deliveries are conducted by a doctor.
• Only 15% are conducted by a nurse, ANM, midwife or Lady Health Visitor.
• In urban areas more than 69% of the deliveries took place in institutions but in rural areas only 30% took place in institutions. (DLHS2)
Maternal Health affects infant health
• A child’s nutritional status begins with a woman’s nutritional status during adolescence and pregnancy.
• The risk of a woman dying from a complication related to pregnancy or childbirth Developed Countries – 1 in 2800 India – 1 in 100
• Many of the surviving mothers suffer from serious disease, or physical disability caused by complications during pregnancy or childbirth.
D. HDI Rank Of India And Parameters Comparison With World (Data Refer To 2014)
HDI rank: 130 out of 188 .
Human Development Index (HDI) Value : 0.609 and World : 0.711.
Life expectancy at birth (years) :68 and World : 71.5.
Gross national income (GNI) per capita(2011 PPP $) :5,497 and World : 14,301.
HDI rank: 130 out of 188 .
Human Development Index (HDI) Value : 0.609 and World : 0.711.
Life expectancy at birth (years) :68 and World : 71.5.
Gross national income (GNI) per capita(2011 PPP $) :5,497 and World : 14,301.
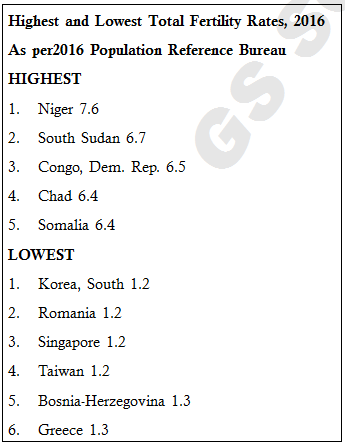
E. Total Fertility Rate Data
In India the Total Fertility Rate is 2.4.
Among the bigger States, Tamilnadu and West Bengal has the lowest TFR of 1.7 and the highest TFR recorded is 3.6 for Bihar.
TFR is considered to be a useful indicator for analysing the prospects for population stabilization.
In India the Total Fertility Rate is 2.4.
Among the bigger States, Tamilnadu and West Bengal has the lowest TFR of 1.7 and the highest TFR recorded is 3.6 for Bihar.
TFR is considered to be a useful indicator for analysing the prospects for population stabilization.
Analysis of TFR , IMR and MMR and Relationship with Population and Health Profile of India
India accounts for 2.4% of the world’s surface area yet it supports 16.7% of the world’s population. As the population grows, the pressure on natural resources will intensify. Population pressure will reduce the per capita availability of land for farming, which will affect availability of food grain, drinking water, besides excluding millions of people from the benefits of health and education and the opportunity to become productive members of society. More than half a billion Indians are less than 25 years of age.
In the states where the growth rates are high, maternal mortality and infant mortality is also very high. Repeated child births aggravate the health and survival risks to both mother and child. According to the International Institute for Population Sciences, 2006 in a study prepared for the Ministry of Health and Family Welfare and National Commission on Population, early pregnancies before the age of 20 increase maternal and child birth risks.
The societal pressure for early child bearing and lack of spacing thereafter affects the mother’s health and can lead to death of the infant or the birth of an underweight child. This sets in motion a vicious cycle of births, deaths and ill-health. It affects overall development. It is vitally necessary to make family planning services available where men and women can access them freely. IIPS’s study indicates that in many states like Bihar, Jharkhand, Rajasthan, Uttar Pradesh and some North Eastern States several districts have a low couple protection rate of 40%. This is in contrast to the rest of the country where the couple protection rates are 52 to 62%. Unless young people adopt family planning methods and space families, population growth will pull back the development of the country.
Panchdeep project
Panchdeep project
It is a project to provide health and social security services to members of ESIC (Employees’ State Insurance Corporation) through a national digital network.
It is the largest e-governance program to provide online facilities to employers and insured people for registration, payment of premium, disbursement of cash benefits and automated Medicare services to all insured people.
Project Panchdeep has five components:
1. Pehchan – Includes all services related to identification, authentication and verification of Insured Persons (IPs) through the use of biometric cards.
2. Milap – Comprises of all services related to provisioning network and bandwidth.
3. Pashan – Consists of services related to hardware for Data Centre, Disaster Recovery, desktops/PCs/Laptops and middleware
4. Dhanwantri – Includes all services related to hospitals and dispensaries and
5. Pragati – For all services related to ERP modules.
Under the project, a massive Enterprise Resource Planning (ERP) would be installed across the country.
The project also takes care of payments, third party bills, the loans and advances, LTC of the employees, among others.
The Insured Persons (IP) would get unique biometric cards under the project.
Delegating more powers to the states, the Centre has decided to form the state executive committees for ESI services
Implementing organizations: ESIC, Ministry of Labour and Employment, GOI.
Shanta Kumar Committee
Shanta Kumar Committee
Government of India (GoI) set up a High Level Committee (HLC) to suggest restructuring or unbundling of FCI with a view to improve its operational efficiency and financial management.
GoI also asked HLC to suggest measures for:
• Overall improvement in management of foodgrains by FCI;
• To suggest reorienting the role and functions of FCI in MSP operations, storage and distribution of food grains and food security systems of the country; and
• To suggest cost effective models for storage and movement of grains and integration of supply chain of food grains in the country.
• To suggest reorienting the role and functions of FCI in MSP operations, storage and distribution of food grains and food security systems of the country; and
• To suggest cost effective models for storage and movement of grains and integration of supply chain of food grains in the country.
Major Recommendations of HLC:
Below is a summary of major recommendations of HLC:
• On procurement related issues
a) HLC recommends that FCI hand over all procurement operations of wheat, paddy and rice to states that have gained sufficient experience in this regard and have created reasonable infrastructure for procurement. These states are Andhra Pradesh, Chhattisgarh, Haryana, Madhya Pradesh, Odisha and Punjab (in alphabetical order).
FCI will accept only the surplus (after deducting the needs of the states under NFSA) from these state governments (not millers) to be moved to deficit states. FCI should move on to help those states where farmers suffer from distress sales at prices much below MSP, and which are dominated by small holdings, like Eastern Uttar Pradesh, Bihar, West Bengal, Assam etc. This is the belt from where second green revolution is expected, and where FCI needs to be pro-active, mobilizing state and other agencies to provide benefits of MSP and procurement to larger number of farmers, especially small and marginal ones.
FCI will accept only the surplus (after deducting the needs of the states under NFSA) from these state governments (not millers) to be moved to deficit states. FCI should move on to help those states where farmers suffer from distress sales at prices much below MSP, and which are dominated by small holdings, like Eastern Uttar Pradesh, Bihar, West Bengal, Assam etc. This is the belt from where second green revolution is expected, and where FCI needs to be pro-active, mobilizing state and other agencies to provide benefits of MSP and procurement to larger number of farmers, especially small and marginal ones.
b) DFPD/FCI at the Centre should enter into an agreement with states before every procurement season regarding costing norms and basic rules for procurement. Three issues are critical to be streamlined to bring rationality in procurement operations and bringing back private sector in competition with state agencies in grain procurement.
• Centre should make it clear to states that in case of any bonus being given by them on top of MSP, Centre will not accept grains under the central pool beyond the quantity needed by the state for its own PDS and OWS.
• The statutory levies including commissions, which vary from less than 2 percent in Gujarat and West Bengal to 14.5 percent in Punjab, need to be brought down uniformly to 3 percent, or at most 4 percent of MSP, and this should be included in MSP itself (states losing revenue due to this rationalization of levies can be compensated through a diversification package for the next 3-5 years).
• Quality checks in procurement have to be adhered to, and anything below the specified quality will not be acceptable under central pool. Quality checks can be done either by FCI and/or any third party accredited agency in a transparent manner with the help of mechanized processes of quality checking.
c) Negotiable warehouse receipt system (NWRs) should be taken up on priority and scaled up quickly. Under this system, farmers can deposit their produce to the registered warehouses, and get say 80 percent advance from banks against their produce valued at MSP. They can sell later when they feel prices are good for them. This will bring back the private sector, reduce massively the costs of storage to the government, and be more compatible with a market economy.
d) GoI needs to revisit its MSP policy. Currently, MSPs are announced for 23 commodities, but effectively price support operates primarily in wheat and rice and that too in selected states. This creates highly skewed incentive structures in favour of wheat and rice. While country is short of pulses and oilseeds (edible oils), their prices often go below MSP without any effective price support. Further, trade policy works independently of MSP policy, and many a times, imports of pulses come at prices much below their MSP. This hampers diversification.
HLC recommends that pulses and oilseeds deserve priority and GoI must provide better price support operations for them, and dovetail their MSP policy with trade policy so that their landed costs are not below their MSP.
• On PDS and NFSA related issues
a) HLC recommends that GoI has a second look at NFSA, its commitments and implementation. Given that leakages in PDS range from 40 to 50 percent, and in some states go as high as 60 to 70 percent, GoI should defer implementation of NFSA in states that have not done end to end computerization; have not put the list of beneficiaries online for anyone to verify, and have not set up vigilance committees to check pilferage from PDS.
b) HLC also recommends to have a relook at the current coverage of 67 percent of population; priority households getting only 5 kgs/person as allocation; and central issue prices being frozen for three years at Rs 3/2/1/kg for rice/wheat/coarse cereals respectively. HLC’s examination of these issue reveals that 67 percent coverage of population is on much higher side, and should be brought down to around 40 percent, which will comfortably cover BPL families and some even above that; 5 kg grain per person to priority households is actually making BPL households worse off, who used to get 7 kg/person under the TPDS.
So, HLC recommends that they be given 7 kg/person. On central issue prices, HLC recommends while Antyodya households can be given grains at Rs 3/2/1/kg for the time being, but pricing for priority households must be linked to MSP, say 50 percent of MSP. Else, HLC feels that this NFSA will put undue financial burden on the exchequer, and investments in agriculture and food space may suffer. HLC would recommend greater investments in agriculture in stabilizing production and building efficient value chains to help the poor as well as farmers.
c) HLC recommends that targeted beneficiaries under NFSA or TPDS are given 6 months ration immediately after the procurement season ends. This will save the consumers from various hassles of monthly arrivals at FPS and also save on the storage costs of agencies. Consumers can be given well designed bins at highly subsidized rates to keep the rations safely in their homes.
d) HLC recommends gradual introduction of cash transfers in PDS, starting with large cities with more than 1 million population; extending it to grain surplus states, and then giving option to deficit states to opt for cash or physical grain distribution. This will be much more cost effective way to help the poor, without much distortion in the production basket, and in line with best international practices.
HLC’s calculations reveal that it can save the exchequer more than Rs 30,000 crores annually, and still giving better deal to consumers. Cash transfers can be indexed with overall price level to protect the amount of real income transfers, given in the name of lady of the house, and routed through Prime Minister’s Jan-Dhan Yojana (PMJDY) and dovetailing Aadhaar and Unique Identification (UID) number. This will empower the consumers, plug high leakages in PDS, save resources, and it can be rolled out over the next 2-3 years.
• On stocking and movement related issues
a) HLC recommends that FCI should outsource its stocking operations to various agencies such as Central Warehousing Corporation, State Warehousing Corporation, Private Sector under Private Entrepreneur Guarantee (PEG) scheme, and even state governments that are building silos through private sector on state lands (as in Madhya Pradesh). It should be done on competitive bidding basis, inviting various stakeholders and creating competition to bring down costs of storage.
b) India needs more bulk handling facilities than it currently has. Many of FCI’s old conventional storages that have existed for long number of years can be converted to silos with the help of private sector and other stocking agencies. Better mechanization is needed in all silos as well as conventional storages.
c) Covered and plinth (CAP) storage should be gradually phased out with no grain stocks remaining in CAP for more than 3 months. Silo bag technology and conventional storages where ever possible should replace CAP.
d) Movement of grains needs to be gradually containerized which will help reduce transit losses, and have faster turn-around-time by having more mechanized facilities at railway sidings.
• On Buffer Stocking Operations and Liquidation Policy
One of the key challenges for FCI has been to carry buffer stocks way in excess of buffer stocking norms. During the last five years, on an average, buffer stocks with FCI have been more than double the buffer stocking norms costing the nation thousands of crores of rupees loss without any worthwhile purpose being served.
The underlying reasons for this situation are many, starting with export bans to open ended procurement with distortions (through bonuses and high statutory levies), but the key factor is that there is no pro-active liquidation policy.
The underlying reasons for this situation are many, starting with export bans to open ended procurement with distortions (through bonuses and high statutory levies), but the key factor is that there is no pro-active liquidation policy.
• On Labour Related Issues
a) FCI engages large number of workers (loaders) to get the job of loading/unloading done smoothly and in time. Currently there are roughly 16,000 departmental workers, about 26,000 workers that operate under Direct Payment System (DPS), some under no work no pay, and about one lakh contract workers.
HLC recommends that the condition of contract labour, which works the hardest and are the largest in number, should be improved by giving them better facilities.
HLC recommends that the condition of contract labour, which works the hardest and are the largest in number, should be improved by giving them better facilities.
• On direct subsidy to farmers
a) Since the whole system of food management operates within the ambit of providing food security at a national as well as at household level, it must be realized that farmers need due incentives to raise productivity and overall food production in the country.
Most of the OECD countries as well as large emerging economies do support their farmers. India also gives large subsidy on fertilizers (more than Rs 72,000 crores in budget of FY 2015 plus pending bills of about Rs 30,000-35,000 crores). Urea prices are administered at a very low level compared to prices of DAP and MOP, creating highly imbalanced use of N, P and K. HLC recommends that farmers be given direct cash subsidy (of about Rs 7000/ha) and fertilizer sector can then be deregulated. This would help plug diversion of urea to non-agricultural uses as well as to neighbouring countries, and help raise the efficiency of fertilizer use.
It may be noted that this type of direct cash subsidy to farmers will go a long way to help those who take loans from money lenders at exorbitant interest rates to buy fertilizers or other inputs, thus relieving some distress in the agrarian sector.
It may be noted that this type of direct cash subsidy to farmers will go a long way to help those who take loans from money lenders at exorbitant interest rates to buy fertilizers or other inputs, thus relieving some distress in the agrarian sector.
• On end to end computerization
a) HLC recommends total end to end computerization of the entire food management system, starting from procurement from farmers, to stocking, movement and finally distribution through TPDS.
• On the new face of FCI
a) The new face of FCI will be akin to an agency for innovations in Food Management System with a primary focus to create competition in every segment of food grain supply chain, from procurement to stocking to movement and finally distribution in TPDS, so that overall costs of the system are substantially reduced, leakages plugged, and it serves larger number of farmers and consumers.
Make in North-East
Make in North-East
The gross state domestic product (GSDP) of all the states of the Northeast is characterised by a subdued manufacturing sector. Besides, most of the eight states in the region have little contribution of their own to their revenue receipts. Assam has the highest contribution of less than 30 per cent (2013-14) closely followed by Sikkim, which is a leader in organic farming and tourism. Nagaland, which has a population of just about 20 lakh, has the worst contribution with just 7.1 per cent of the revenue. Arunachal Pradesh contributes 8.8 per cent despite its hydro power potential. In order to develop the region as a destination for investors and tourists government has launched Make in North East initiative.
“Make in Northeast” initiative, inspired by “Make in India” concept, will in the long run seek to promote exclusive Northeast expertise in areas like tea processing, organic farming, food processing, and exploitation of wind power through wind mills, AYUSH, wellness therapies like spas, etc.
The initiative has been taken to inspire countrymen to not just “Look East” but also “Act East”.
The new initiative will begin with a comprehensive tourism plan for the region. Mega circuit and mega destination projects of Tourism Ministry in the area will also be pursued.
One of the important objectives of “Make in Northeast” initiative is not only to generate revenue for Northeast but also to create job opportunities to prevent the exodus of youth which is presently taking place from the region to the rest of the country.

No comments:
Post a Comment